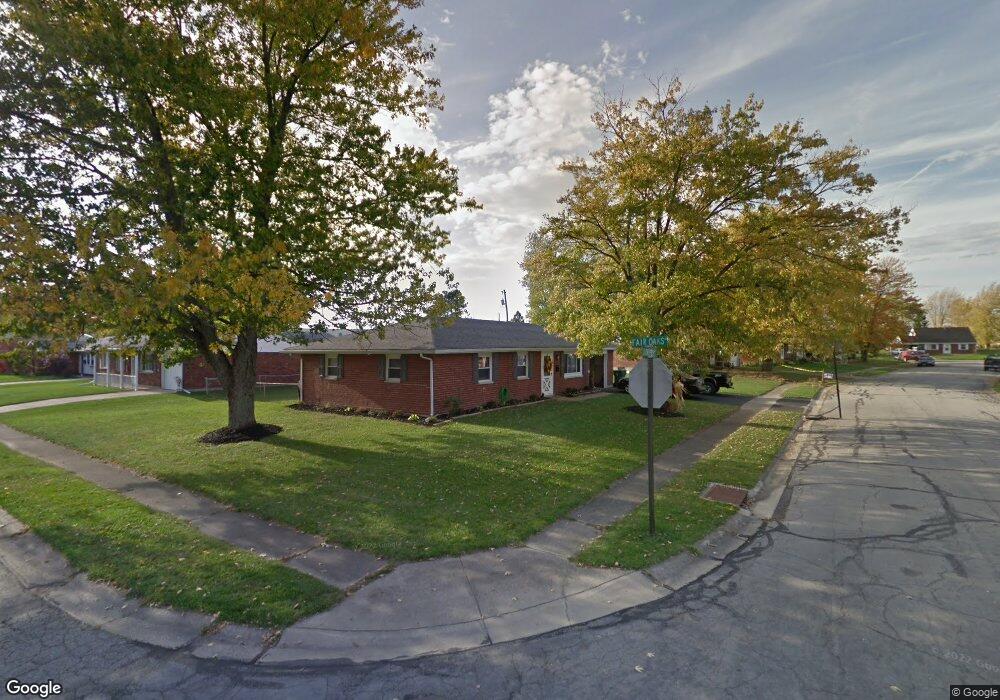
1001 Juniper Way Sidney, OH 45365
Estimated Value: $161,000 - $173,390
3
Beds
1
Bath
1,134
Sq Ft
$149/Sq Ft
Est. Value
About This Home
This home is located at 1001 Juniper Way, Sidney, OH 45365 and is currently estimated at $169,348, approximately $149 per square foot. 1001 Juniper Way is a home located in Shelby County with nearby schools including Sidney High School, Holy Angels Catholic School, and Christian Academy Schools.
Ownership History
Date
Name
Owned For
Owner Type
Purchase Details
Closed on
Aug 5, 2016
Sold by
Carrington Mortgage Services Llc
Bought by
T&B Martin Properties Llc
Current Estimated Value
Purchase Details
Closed on
Jul 1, 2016
Sold by
Diener David W and Diener Cathy J
Bought by
Carrington Mortgage Services Llc
Purchase Details
Closed on
Aug 15, 2008
Sold by
American Land Investments Ltd
Bought by
Diener David W
Home Financials for this Owner
Home Financials are based on the most recent Mortgage that was taken out on this home.
Original Mortgage
$101,796
Interest Rate
6.42%
Mortgage Type
Purchase Money Mortgage
Purchase Details
Closed on
Jul 7, 2007
Sold by
Household Realty Corp
Bought by
American Land Investments Ltd
Purchase Details
Closed on
Dec 15, 2006
Sold by
Dearwester Vernelle N
Bought by
Household Realty Corp
Purchase Details
Closed on
Aug 17, 1992
Bought by
Dearwester Ver
Create a Home Valuation Report for This Property
The Home Valuation Report is an in-depth analysis detailing your home's value as well as a comparison with similar homes in the area
Home Values in the Area
Average Home Value in this Area
Purchase History
| Date | Buyer | Sale Price | Title Company |
|---|---|---|---|
| T&B Martin Properties Llc | $55,000 | Carrington Title Svcs Llc | |
| Carrington Mortgage Services Llc | $47,000 | Attorney | |
| Diener David W | $99,800 | Attorney | |
| American Land Investments Ltd | $59,000 | Foundation Title Agency Inc | |
| Household Realty Corp | $63,000 | Attorney | |
| Dearwester Ver | $57,300 | -- |
Source: Public Records
Mortgage History
| Date | Status | Borrower | Loan Amount |
|---|---|---|---|
| Previous Owner | Diener David W | $101,796 |
Source: Public Records
Tax History Compared to Growth
Tax History
| Year | Tax Paid | Tax Assessment Tax Assessment Total Assessment is a certain percentage of the fair market value that is determined by local assessors to be the total taxable value of land and additions on the property. | Land | Improvement |
|---|---|---|---|---|
| 2024 | $1,866 | $45,500 | $9,260 | $36,240 |
| 2023 | $1,866 | $45,500 | $9,260 | $36,240 |
| 2022 | $1,591 | $33,170 | $8,140 | $25,030 |
| 2021 | $5,952 | $33,170 | $8,140 | $25,030 |
| 2020 | $5,952 | $33,170 | $8,140 | $25,030 |
| 2019 | $1,137 | $27,270 | $6,750 | $20,520 |
| 2018 | $1,122 | $27,270 | $6,750 | $20,520 |
| 2017 | $1,128 | $27,270 | $6,750 | $20,520 |
| 2016 | $1,061 | $26,960 | $6,750 | $20,210 |
| 2015 | $1,065 | $26,960 | $6,750 | $20,210 |
| 2014 | $1,064 | $26,960 | $6,750 | $20,210 |
| 2013 | $1,156 | $27,060 | $6,750 | $20,310 |
Source: Public Records
Map
Nearby Homes
- 1624 Holly Place
- 1614 Cedarbrook Place
- 807 6th Ave
- 1726 Fair Oaks Dr
- 2009 Fair Oaks Dr
- 621 Maywood Place
- 614 Marilyn Dr
- 1249 Cinnamon Ridge Ln
- 00 Folkerth Ave
- Aspen Plan at Burr Oak Mill
- Birch with Full Basement Plan at Burr Oak Mill
- Cedar with Full Basement Plan at Burr Oak Mill
- Elder with Full Basement Plan at Burr Oak Mill
- Spruce Plan at Burr Oak Mill
- 1112 Hazel Nut Ln
- 1355 Gray Oak Dr
- 1424 Silverleaf Oak St
- 1370 Silverleaf Oak St
- 1414 Gray Oak Dr
- 1356 Shaggy Bark Dr
- 1843 Fair Oaks Dr
- 1848 Fair Oaks Dr
- 1855 Fair Oaks Dr
- 1844 Fair Oaks Dr
- 1007 Juniper Way
- 1852 Fair Oaks Dr
- 1837 Fair Oaks Dr
- 1850 Fair Oaks Dr
- 1010 Juniper Way
- 1834 Fair Oaks Dr
- 1831 Fair Oaks Dr
- 1013 Juniper Way
- 1861 Fair Oaks Dr
- 1854 Fair Oaks Dr
- 1019 Juniper Way
- 1016 Juniper Way
- 1826 Fair Oaks Dr
- 1867 Fair Oaks Dr
- 1856 Fair Oaks Dr
- 1860 Fair Oaks Dr