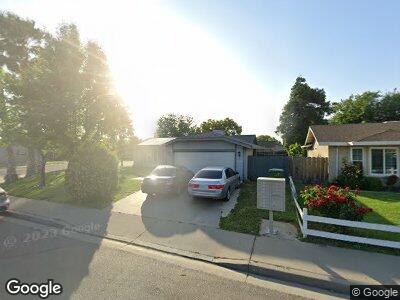
1001 Lacy Way Turlock, CA 95380
Wright NeighborhoodEstimated Value: $398,000 - $416,201
3
Beds
2
Baths
1,226
Sq Ft
$332/Sq Ft
Est. Value
About This Home
This home is located at 1001 Lacy Way, Turlock, CA 95380 and is currently estimated at $407,050, approximately $332 per square foot. 1001 Lacy Way is a home located in Stanislaus County with nearby schools including Cunningham Elementary School, Marvin A. Dutcher Middle School, and Turlock Junior High School.
Ownership History
Date
Name
Owned For
Owner Type
Purchase Details
Closed on
Nov 15, 2006
Sold by
Sherwood Sue
Bought by
Lopez Elizabeth
Current Estimated Value
Home Financials for this Owner
Home Financials are based on the most recent Mortgage that was taken out on this home.
Original Mortgage
$248,000
Outstanding Balance
$166,438
Interest Rate
7.87%
Mortgage Type
Purchase Money Mortgage
Estimated Equity
$260,280
Purchase Details
Closed on
Mar 21, 1995
Sold by
Aguilar Andrew R and Hall Rick L
Bought by
Sherwood Sue
Home Financials for this Owner
Home Financials are based on the most recent Mortgage that was taken out on this home.
Original Mortgage
$76,000
Interest Rate
8.9%
Create a Home Valuation Report for This Property
The Home Valuation Report is an in-depth analysis detailing your home's value as well as a comparison with similar homes in the area
Home Values in the Area
Average Home Value in this Area
Purchase History
| Date | Buyer | Sale Price | Title Company |
|---|---|---|---|
| Lopez Elizabeth | $310,000 | Alliance Title Company | |
| Sherwood Sue | $95,000 | Chicago Title Company |
Source: Public Records
Mortgage History
| Date | Status | Borrower | Loan Amount |
|---|---|---|---|
| Open | Lopez Elizabeth | $248,000 | |
| Previous Owner | Sherwood Sue | $20,000 | |
| Previous Owner | Sherwood Sue | $75,000 | |
| Previous Owner | Sherwood Sue | $76,000 |
Source: Public Records
Tax History Compared to Growth
Tax History
| Year | Tax Paid | Tax Assessment Tax Assessment Total Assessment is a certain percentage of the fair market value that is determined by local assessors to be the total taxable value of land and additions on the property. | Land | Improvement |
|---|---|---|---|---|
| 2024 | $3,775 | $358,500 | $200,000 | $158,500 |
| 2023 | $3,844 | $358,500 | $200,000 | $158,500 |
| 2022 | $3,685 | $341,500 | $200,000 | $141,500 |
| 2021 | $3,365 | $311,000 | $170,000 | $141,000 |
| 2020 | $2,856 | $264,000 | $130,000 | $134,000 |
| 2019 | $2,864 | $264,000 | $130,000 | $134,000 |
| 2018 | $2,601 | $236,000 | $110,000 | $126,000 |
| 2017 | $2,371 | $216,500 | $80,000 | $136,500 |
| 2016 | $1,973 | $190,000 | $60,000 | $130,000 |
| 2015 | $2,002 | $191,500 | $48,000 | $143,500 |
| 2014 | $1,672 | $159,500 | $40,000 | $119,500 |
Source: Public Records
Map
Nearby Homes
- 467 Tandoori Way
- 472 Tandoori Way
- 710 E Linwood Ave
- 205 G St
- 924 9th St
- 102 I St
- 1412 S 1st St Unit I
- 1850 English Ave
- 2333 Lander Ave
- 2607 E Linwood Ave
- 887 Zina Ln
- 1109 Alpha Rd
- 212 4th St
- 364 Angelus St
- 1307 S Johnson Rd
- 387 Angelus St
- 501 Montana Ave
- 2019 Lee Rae Ct
- 2600 Polous Dr
- 2630 Polous Dr