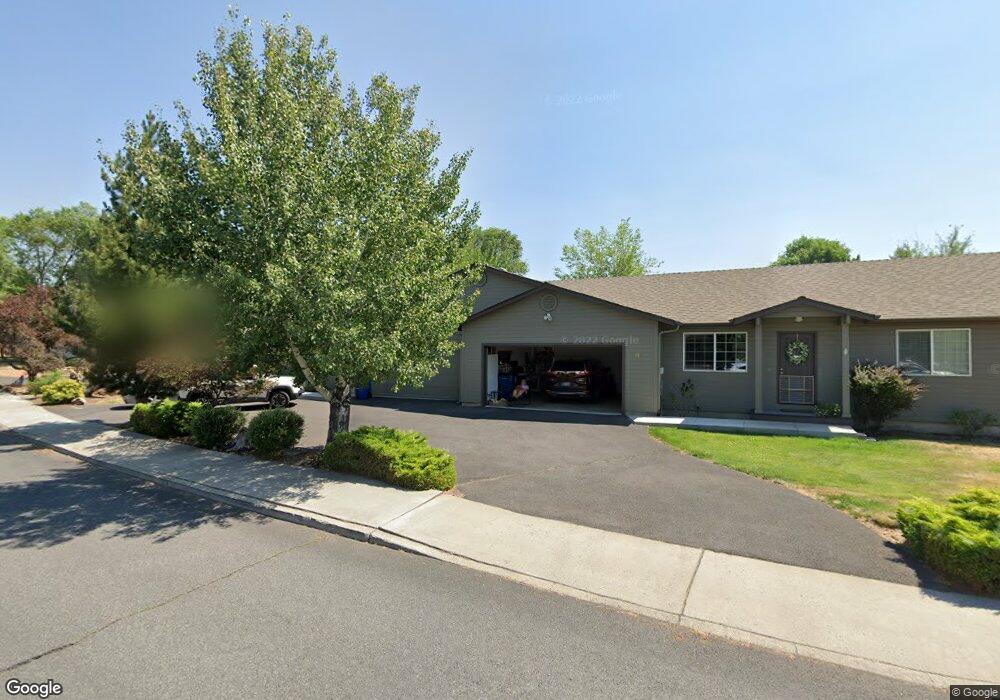
1001 NE Ross Rd Bend, OR 97701
Orchard District NeighborhoodEstimated Value: $634,000 - $690,043
4
Beds
4
Baths
2,116
Sq Ft
$308/Sq Ft
Est. Value
About This Home
This home is located at 1001 NE Ross Rd, Bend, OR 97701 and is currently estimated at $651,261, approximately $307 per square foot. 1001 NE Ross Rd is a home located in Deschutes County with nearby schools including North Star Elementary School, Sky View Middle School, and Mountain View Senior High School.
Ownership History
Date
Name
Owned For
Owner Type
Purchase Details
Closed on
May 2, 2023
Sold by
Lanning Gabriel J
Bought by
Dream Beaver Trust
Current Estimated Value
Purchase Details
Closed on
Jun 30, 2020
Sold by
Spain Steven Dale and Spain Steven
Bought by
Lanning Gabriel and Lanning Dayna
Purchase Details
Closed on
Mar 4, 2020
Sold by
Spain Steven Dale
Bought by
Demian Heald Solo 401K
Purchase Details
Closed on
Jan 6, 2020
Sold by
Spain Steven Dale
Bought by
Lanning Gabriel and Lanning Dayna
Purchase Details
Closed on
Oct 26, 2007
Sold by
Spain Arden E
Bought by
Spain Steven D
Home Financials for this Owner
Home Financials are based on the most recent Mortgage that was taken out on this home.
Original Mortgage
$171,000
Interest Rate
6.21%
Mortgage Type
Unknown
Purchase Details
Closed on
Jul 6, 2007
Sold by
Spain Arden
Bought by
Spain Steve and Spain Arden
Create a Home Valuation Report for This Property
The Home Valuation Report is an in-depth analysis detailing your home's value as well as a comparison with similar homes in the area
Home Values in the Area
Average Home Value in this Area
Purchase History
| Date | Buyer | Sale Price | Title Company |
|---|---|---|---|
| Dream Beaver Trust | -- | None Listed On Document | |
| Lanning Gabriel | -- | None Available | |
| Demian Heald Solo 401K | -- | None Available | |
| Lanning Gabriel | $310,000 | None Available | |
| Spain Steven D | -- | Accommodation | |
| Spain Steve | -- | None Available |
Source: Public Records
Mortgage History
| Date | Status | Borrower | Loan Amount |
|---|---|---|---|
| Previous Owner | Spain Steven D | $171,000 |
Source: Public Records
Tax History
| Year | Tax Paid | Tax Assessment Tax Assessment Total Assessment is a certain percentage of the fair market value that is determined by local assessors to be the total taxable value of land and additions on the property. | Land | Improvement |
|---|---|---|---|---|
| 2025 | $5,979 | $353,890 | -- | -- |
| 2024 | $5,753 | $343,590 | -- | -- |
| 2023 | $5,333 | $333,590 | $0 | $0 |
| 2022 | $4,976 | $314,450 | $0 | $0 |
| 2021 | $4,983 | $305,300 | $0 | $0 |
| 2020 | $4,728 | $305,300 | $0 | $0 |
| 2019 | $4,596 | $296,410 | $0 | $0 |
| 2018 | $4,466 | $287,780 | $0 | $0 |
| 2017 | $4,335 | $279,400 | $0 | $0 |
| 2016 | $4,134 | $271,270 | $0 | $0 |
| 2015 | $4,016 | $263,370 | $0 | $0 |
| 2014 | $3,538 | $238,470 | $0 | $0 |
Source: Public Records
Map
Nearby Homes
- 2843 NE Waller Dr
- 2640 NE 8th St
- 2667 NE Jones Rd
- 2642 NE Keats Dr
- 1407 NE Talon Ct
- 1482 NE Rumgay Ln
- 530 NE Majesty Ln
- 2109 NE 11th Place
- 642 NE Seward Ave
- 62906 Bilyeu Way
- 2739 NE Cordata
- 832 NE Revere Ave
- 21620 NE Butler Market Rd
- 2342 NE Shadow Brook Place
- 20530 NE Empire Ave
- 20532 NE Empire Ave
- 20528 NE Empire Ave
- 1532 NE 9th St
- 2917 NE Purcell Blvd
- 20514 NE Empire Ave
- 928 NE Hidden Valley Dr
- 1005 NE Ross Rd
- 898 NE Hidden Valley Dr Unit 1
- 898 NE Hidden Valley Dr
- 898 NE Hidden Valley Dr Unit 2
- 898 NE Hidden Valley Dr
- 898 NE Hidden Valley Dr Unit A & B
- 2933 NE Canoe Ct
- 901 NE Hidden Valley Dr
- 901 NE Hidden Valley Dr Unit 1 & 2
- 1000 NE Ross Rd
- 956 NE Hidden Valley Dr
- 944 NE Hidden Valley Dr
- 1009 NE Ross Rd
- 894 NE Hidden Valley Dr
- 978-980 Hidden Valley
- 899 NE Hidden Valley Dr
- 978 NE Hidden Valley Dr
- 931 NE Hidden Valley Dr
Your Personal Tour Guide
Ask me questions while you tour the home.