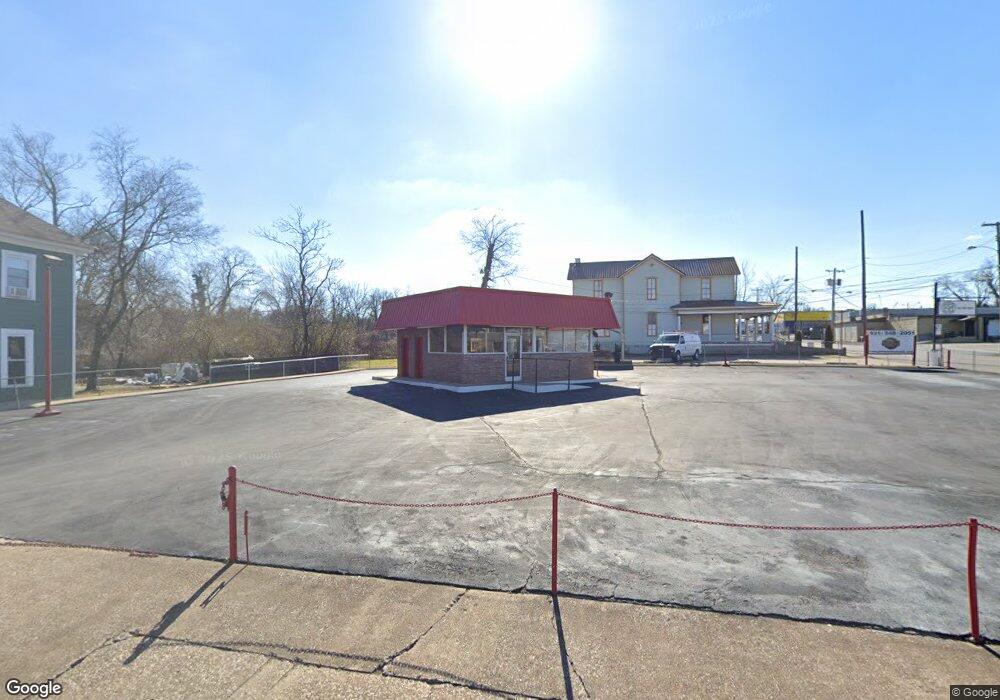
1001 S Main St Columbia, TN 38401
Estimated Value: $357,210
--
Bed
--
Bath
550
Sq Ft
$649/Sq Ft
Est. Value
About This Home
This home is located at 1001 S Main St, Columbia, TN 38401 and is currently priced at $357,210, approximately $649 per square foot. 1001 S Main St is a home located in Maury County with nearby schools including R. Howell Elementary School, E.A. Cox Middle School, and Columbia Central High School.
Ownership History
Date
Name
Owned For
Owner Type
Purchase Details
Closed on
Oct 22, 2021
Sold by
West Richelle
Bought by
Wismer David A and Irr Mary
Current Estimated Value
Purchase Details
Closed on
Oct 1, 2020
Sold by
Bostelman Realty Llc
Bought by
West Richelle
Home Financials for this Owner
Home Financials are based on the most recent Mortgage that was taken out on this home.
Original Mortgage
$196,800
Interest Rate
2.8%
Mortgage Type
Commercial
Purchase Details
Closed on
Jan 28, 2020
Sold by
Bostelman Steven R and Bostelman Steve
Bought by
Bostelman Realty Llc
Purchase Details
Closed on
Aug 12, 2002
Sold by
Totty John K and Totty Debra E
Bought by
Bostelman Steve
Purchase Details
Closed on
Aug 28, 1997
Sold by
Donnelly Evalyn T
Bought by
Totty John K
Purchase Details
Closed on
Aug 8, 1997
Sold by
Donnelly Evalyn T
Bought by
Donnelly Evalyn T
Create a Home Valuation Report for This Property
The Home Valuation Report is an in-depth analysis detailing your home's value as well as a comparison with similar homes in the area
Home Values in the Area
Average Home Value in this Area
Purchase History
| Date | Buyer | Sale Price | Title Company |
|---|---|---|---|
| Wismer David A | $315,000 | Rudy Title And Escrow Llc | |
| West Richelle | $246,000 | Rudy Title And Escrow Llc | |
| West Richelle | $246,000 | Rudy Title & Escrow | |
| Bostelman Realty Llc | -- | None Available | |
| Bostelman Steve | $60,000 | -- | |
| Totty John K | $30,000 | -- | |
| Donnelly Evalyn T | -- | -- |
Source: Public Records
Mortgage History
| Date | Status | Borrower | Loan Amount |
|---|---|---|---|
| Previous Owner | West Richelle | $196,800 |
Source: Public Records
Tax History Compared to Growth
Tax History
| Year | Tax Paid | Tax Assessment Tax Assessment Total Assessment is a certain percentage of the fair market value that is determined by local assessors to be the total taxable value of land and additions on the property. | Land | Improvement |
|---|---|---|---|---|
| 2023 | $1,196 | $62,600 | $60,000 | $2,600 |
| 2022 | $1,713 | $62,600 | $60,000 | $2,600 |
| 2021 | $1,713 | $21,560 | $18,600 | $2,960 |
| 2020 | $732 | $21,560 | $18,600 | $2,960 |
| 2019 | $500 | $21,560 | $18,600 | $2,960 |
| 2018 | $482 | $21,560 | $18,600 | $2,960 |
| 2017 | $792 | $18,600 | $18,600 | $0 |
| 2016 | $791 | $18,600 | $18,600 | $0 |
| 2015 | $755 | $18,600 | $18,600 | $0 |
| 2014 | $755 | $18,600 | $18,600 | $0 |
Source: Public Records
Map
Nearby Homes
- 106 E 9th St
- 107 E 9th St Unit D-7
- 107 E 9th St Unit C-6
- 107 E 9th St Unit C-5
- 1124 Woodland St
- 1009 Woodland St
- 812 S Main St
- 911 S High St
- 917 S High St
- 1115 S High St
- 1119 S High St
- 1117 S Glade St
- 1109 Parker St
- 1104 Bridge St
- 808 Walker St
- 509 White St
- 811 School St
- 515 E 8th St
- 2509 Drumwright Way
- 1919 Hildebrand Ln
- 1005 S Main St
- 105 E 9th St
- 104 E 9th St
- 107 E 9th St Unit C-2
- 107 E 9th St Unit C-1
- 107 E 9th St Unit D-2
- 107 E 9th St Unit D-1
- 1007 S Main St
- 1000 S Main St
- 1000 S Main St Unit St
- 108 E 9th St
- 1004 S Main St
- 1011 S Main St
- 1004 Woodland St
- 1006 Woodland St
- 1002 Woodland St
- 111 E 9th St
- 1008 Woodland St
- 1010 Woodland St
- 912 Woodland St