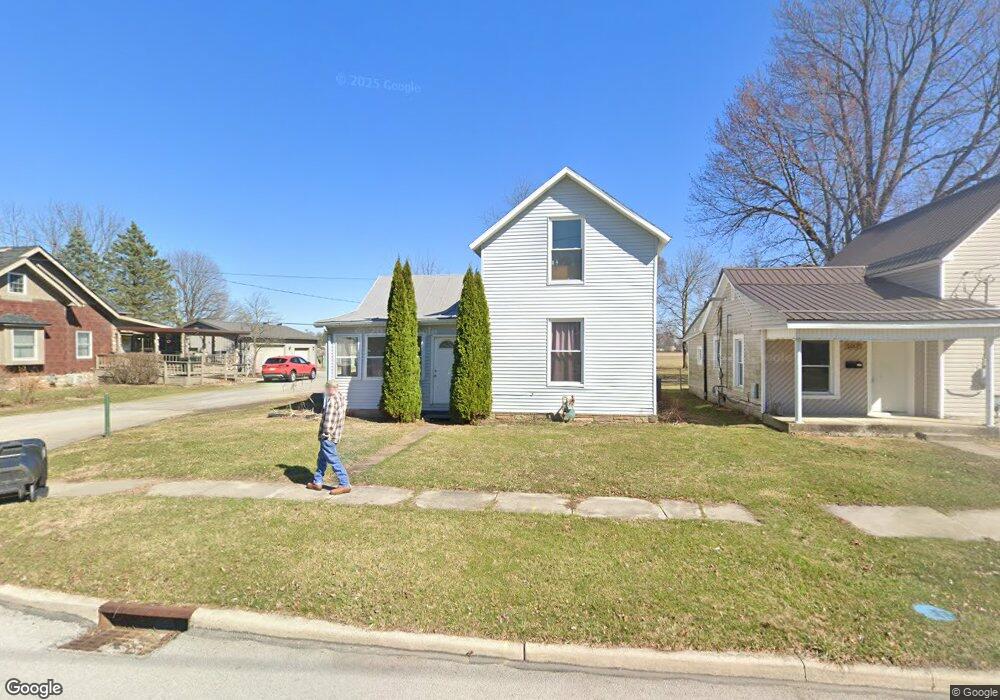
1001 Selby St Findlay, OH 45840
Estimated Value: $144,691 - $162,000
3
Beds
1
Bath
1,152
Sq Ft
$133/Sq Ft
Est. Value
About This Home
This home is located at 1001 Selby St, Findlay, OH 45840 and is currently estimated at $153,423, approximately $133 per square foot. 1001 Selby St is a home located in Hancock County with nearby schools including Whittier Elementary School, Wilson Vance Elementary School, and Donnell Middle School.
Ownership History
Date
Name
Owned For
Owner Type
Purchase Details
Closed on
Dec 10, 2018
Sold by
Koomen Amy E Bowman
Bought by
Bayliff John
Current Estimated Value
Home Financials for this Owner
Home Financials are based on the most recent Mortgage that was taken out on this home.
Original Mortgage
$87,912
Outstanding Balance
$77,374
Interest Rate
4.75%
Estimated Equity
$76,049
Purchase Details
Closed on
Sep 1, 2017
Sold by
Eenhoorn Proepites Llc
Bought by
Best Vicki Jo
Purchase Details
Closed on
Dec 30, 2014
Sold by
Koomen Jason and Bowman Amy
Bought by
Eenhoorn Properties Llc
Purchase Details
Closed on
Mar 17, 2005
Sold by
Estate Of Marion E Davis
Bought by
Davis Carol J
Create a Home Valuation Report for This Property
The Home Valuation Report is an in-depth analysis detailing your home's value as well as a comparison with similar homes in the area
Home Values in the Area
Average Home Value in this Area
Purchase History
| Date | Buyer | Sale Price | Title Company |
|---|---|---|---|
| Bayliff John | $28,800 | -- | |
| Best Vicki Jo | $65,000 | None Available | |
| Eenhoorn Properties Llc | -- | Mid Am Title | |
| Davis Carol J | -- | -- |
Source: Public Records
Mortgage History
| Date | Status | Borrower | Loan Amount |
|---|---|---|---|
| Open | Bayliff John | $87,912 | |
| Closed | Bayliff John | -- | |
| Closed | Best Vicki Jo | $0 |
Source: Public Records
Tax History Compared to Growth
Tax History
| Year | Tax Paid | Tax Assessment Tax Assessment Total Assessment is a certain percentage of the fair market value that is determined by local assessors to be the total taxable value of land and additions on the property. | Land | Improvement |
|---|---|---|---|---|
| 2024 | $932 | $26,230 | $3,610 | $22,620 |
| 2023 | $933 | $26,230 | $3,610 | $22,620 |
| 2022 | $930 | $26,230 | $3,610 | $22,620 |
| 2021 | $862 | $21,170 | $5,240 | $15,930 |
| 2020 | $862 | $21,170 | $5,240 | $15,930 |
| 2019 | $844 | $21,170 | $5,240 | $15,930 |
| 2018 | $844 | $19,370 | $3,280 | $16,090 |
| 2017 | $432 | $19,370 | $3,280 | $16,090 |
| 2016 | $865 | $19,370 | $3,280 | $16,090 |
| 2015 | $667 | $14,840 | $3,280 | $11,560 |
| 2014 | $668 | $14,840 | $3,280 | $11,560 |
| 2012 | $675 | $14,840 | $3,280 | $11,560 |
Source: Public Records
Map
Nearby Homes
- 820 Selby St
- 904 Morse St
- 15591 Canadian Way
- 15586 Canadian Way
- 15615 Canadian Way
- 1109 Brookside Dr
- 1037 Fishlock Ave
- 1301 Fishlock Ave
- 619 Fishlock Ave
- 1011 Stall Dr
- 1802 Lippincott Ave
- 1008 Eastview Dr
- 817 Park St
- 1109 Park St
- 420 1st St
- 1200 5th St
- 1001 Decker Ave
- 804 6th St
- 1000 Tarra Oaks Dr
- 0 Blanchard Ave