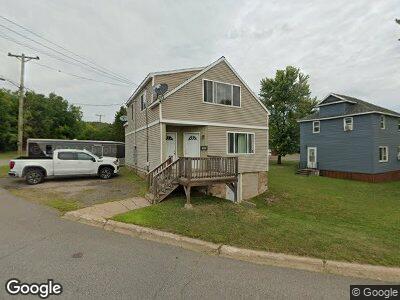
1001 Shackleton St Eveleth, MN 55734
Estimated Value: $82,600 - $127,000
4
Beds
2
Baths
1,470
Sq Ft
$71/Sq Ft
Est. Value
About This Home
This home is located at 1001 Shackleton St, Eveleth, MN 55734 and is currently estimated at $104,150, approximately $70 per square foot. 1001 Shackleton St is a home located in St. Louis County with nearby schools including Nelle Shean Elementary School, Franklin Elementary School, and Eveleth-Gilbert Junior High School.
Ownership History
Date
Name
Owned For
Owner Type
Purchase Details
Closed on
Apr 24, 2014
Sold by
Lemoyne John P
Bought by
Gams Alan L
Current Estimated Value
Home Financials for this Owner
Home Financials are based on the most recent Mortgage that was taken out on this home.
Original Mortgage
$43,200
Outstanding Balance
$34,488
Interest Rate
4.8%
Mortgage Type
New Conventional
Purchase Details
Closed on
Nov 18, 2010
Sold by
Queen City Federal Savings Bank
Bought by
Lemoyne John P
Purchase Details
Closed on
Apr 20, 2010
Sold by
Mattson Branden G and Mattson Lee C
Bought by
Queen City Federal Savings Bank
Purchase Details
Closed on
Feb 7, 2002
Sold by
Richards J Carver and Richards Barbara
Bought by
Mattson Branden G and Mattson Lee C
Home Financials for this Owner
Home Financials are based on the most recent Mortgage that was taken out on this home.
Original Mortgage
$31,000
Interest Rate
7.75%
Create a Home Valuation Report for This Property
The Home Valuation Report is an in-depth analysis detailing your home's value as well as a comparison with similar homes in the area
Home Values in the Area
Average Home Value in this Area
Purchase History
| Date | Buyer | Sale Price | Title Company |
|---|---|---|---|
| Gams Alan L | $61,000 | Up North | |
| Lemoyne John P | $5,000 | Up North | |
| Queen City Federal Savings Bank | $44,942 | None Available | |
| Mattson Branden G | $30,000 | -- |
Source: Public Records
Mortgage History
| Date | Status | Borrower | Loan Amount |
|---|---|---|---|
| Open | Gams Alan L | $43,200 | |
| Previous Owner | Lemoyne John P | $41,000 | |
| Previous Owner | Mattson Branden Garrett | $280,000 | |
| Previous Owner | Mattson Branden G | $31,000 |
Source: Public Records
Tax History Compared to Growth
Tax History
| Year | Tax Paid | Tax Assessment Tax Assessment Total Assessment is a certain percentage of the fair market value that is determined by local assessors to be the total taxable value of land and additions on the property. | Land | Improvement |
|---|---|---|---|---|
| 2023 | $558 | $78,700 | $4,200 | $74,500 |
| 2022 | $670 | $59,000 | $3,800 | $55,200 |
| 2021 | $574 | $68,400 | $3,400 | $65,000 |
| 2020 | $550 | $68,400 | $3,400 | $65,000 |
| 2019 | $462 | $68,400 | $3,400 | $65,000 |
| 2018 | $342 | $68,400 | $3,400 | $65,000 |
| 2017 | $414 | $60,800 | $3,400 | $57,400 |
| 2016 | $370 | $65,900 | $6,800 | $59,100 |
| 2015 | $1,198 | $39,500 | $4,100 | $35,400 |
| 2014 | $1,198 | $63,800 | $6,800 | $57,000 |
Source: Public Records
Map
Nearby Homes
- 1001 Shackleton St
- 1001-1001 1/2 Shacklton
- 1001 1/2 Shackleton St
- 1000 Shackleton St
- 1132 Lincoln Ave
- 12 Old Virginia Rd
- 1130 Lincoln Ave
- 1128 Lincoln Ave
- 1131 Lincoln Ave
- 1126 Lincoln Ave
- 1129 Lincoln Ave
- 1123 Adams Ave
- 16 Shackleton St
- 1127 Lincoln Ave
- 1122 Lincoln Ave
- 217 Old Virginia Rd
- 1119 Adams Ave
- 1125 Lincoln Ave
- 400 Shackleton Ct
- 1123 Lincoln Ave