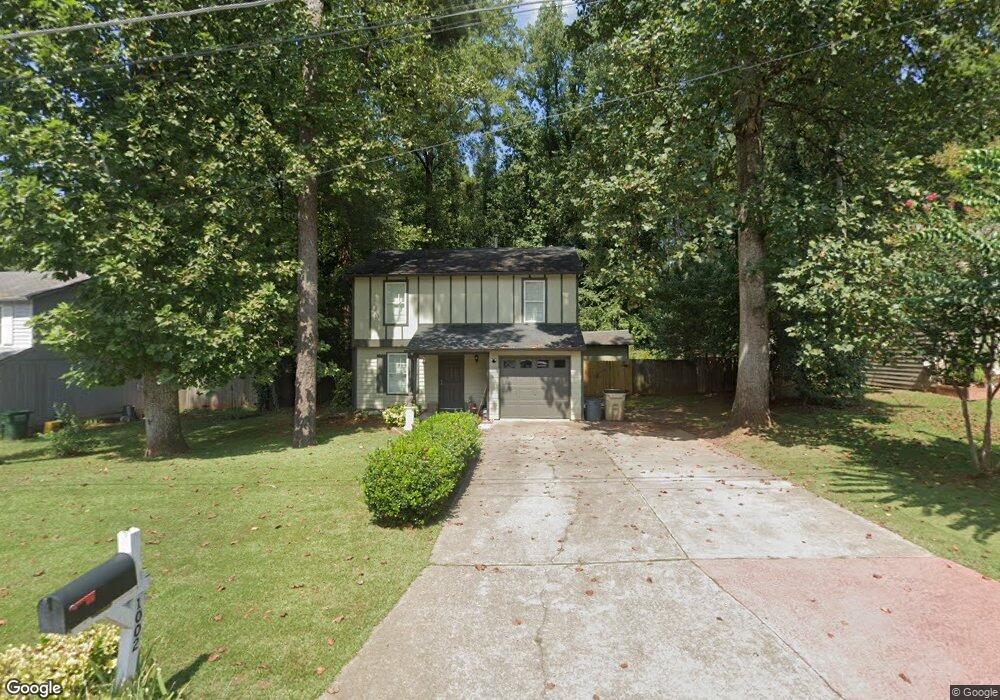
1002 Riva Ridge Dr Norcross, GA 30093
Estimated Value: $293,000 - $304,000
3
Beds
2
Baths
1,140
Sq Ft
$260/Sq Ft
Est. Value
About This Home
This home is located at 1002 Riva Ridge Dr, Norcross, GA 30093 and is currently estimated at $296,646, approximately $260 per square foot. 1002 Riva Ridge Dr is a home located in Gwinnett County with nearby schools including Lilburn Elementary School, Lilburn Middle School, and Meadowcreek High School.
Ownership History
Date
Name
Owned For
Owner Type
Purchase Details
Closed on
Jan 19, 2010
Sold by
Bank Of Ny Ramp 2002Rs7
Bought by
Erzrumyan Taguhi
Current Estimated Value
Purchase Details
Closed on
Nov 3, 2009
Sold by
Gutierrez Jose A
Bought by
Bank Of Ny Ramp 2002Rs7
Purchase Details
Closed on
Sep 27, 2002
Sold by
Ruiz Israel
Bought by
Gutierrez Jose A
Home Financials for this Owner
Home Financials are based on the most recent Mortgage that was taken out on this home.
Original Mortgage
$107,250
Interest Rate
6.27%
Mortgage Type
New Conventional
Purchase Details
Closed on
May 25, 1999
Sold by
Pishock Dennis
Bought by
Ruiz Israel
Home Financials for this Owner
Home Financials are based on the most recent Mortgage that was taken out on this home.
Original Mortgage
$88,229
Interest Rate
6.94%
Mortgage Type
FHA
Purchase Details
Closed on
Aug 30, 1996
Sold by
Emam Tamara L Jallaludd
Bought by
Pischock Dennis Melissa
Create a Home Valuation Report for This Property
The Home Valuation Report is an in-depth analysis detailing your home's value as well as a comparison with similar homes in the area
Home Values in the Area
Average Home Value in this Area
Purchase History
| Date | Buyer | Sale Price | Title Company |
|---|---|---|---|
| Erzrumyan Taguhi | $42,000 | -- | |
| Bank Of Ny Ramp 2002Rs7 | $60,000 | -- | |
| Gutierrez Jose A | $112,900 | -- | |
| Ruiz Israel | $88,900 | -- | |
| Pischock Dennis Melissa | $78,900 | -- |
Source: Public Records
Mortgage History
| Date | Status | Borrower | Loan Amount |
|---|---|---|---|
| Previous Owner | Gutierrez Jose A | $107,250 | |
| Previous Owner | Ruiz Israel | $88,229 | |
| Closed | Pischock Dennis Melissa | $0 |
Source: Public Records
Tax History Compared to Growth
Tax History
| Year | Tax Paid | Tax Assessment Tax Assessment Total Assessment is a certain percentage of the fair market value that is determined by local assessors to be the total taxable value of land and additions on the property. | Land | Improvement |
|---|---|---|---|---|
| 2025 | $3,692 | $95,080 | $21,120 | $73,960 |
| 2024 | $3,547 | $89,960 | $21,120 | $68,840 |
| 2023 | $3,547 | $84,280 | $20,000 | $64,280 |
| 2022 | $2,928 | $73,680 | $14,000 | $59,680 |
| 2021 | $2,279 | $54,840 | $14,000 | $40,840 |
| 2020 | $2,290 | $54,840 | $14,000 | $40,840 |
| 2019 | $1,858 | $44,800 | $11,600 | $33,200 |
| 2018 | $1,853 | $44,800 | $11,600 | $33,200 |
| 2016 | $1,492 | $33,960 | $9,200 | $24,760 |
| 2015 | $1,194 | $25,160 | $6,000 | $19,160 |
| 2014 | $1,199 | $25,160 | $6,000 | $19,160 |
Source: Public Records
Map
Nearby Homes
- 1066 Worcester Place NW Unit 4
- 5271 Williams Rd Unit A-1
- 5323 Sherwin Dr
- 5331 Sherwin Dr
- 5343 Sherwin Dr Unit 15
- 5333 Bishops Cir
- 5345 Seattle Slew Ct Unit 3
- 5181 Cold Springs Dr NW
- 1133 Sandune Dr
- 0 Harbins Rd NW Unit 7598091
- 5148 Whited Way NW Unit 1
- 5425 Village Green Square Unit 3
- 5431 Village Green Square Unit 1018
- 1013 Sandune Dr
- 5554 Clover Rise Ln Unit 2
- 5016 Comanche Ct NW
- 5622 Williamsburg Dr
- 5444 Wylstream
- 5384 Durham View Ct NW
- 5605 Rock Place Ct
- 1008 Riva Ridge Dr
- 996 Riva Ridge Dr
- 1014 Riva Ridge Dr
- 990 Riva Ridge Dr
- 1003 Riva Ridge Dr
- 1009 Riva Ridge Dr
- 984 Riva Ridge Dr
- 1020 Riva Ridge Dr
- 1015 Riva Ridge Dr
- 991 Riva Ridge Dr
- 1021 Riva Ridge Dr
- 978 Riva Ridge Dr
- 1075 Mockingbird Trail Unit 1
- 1026 Riva Ridge Dr
- 985 Riva Ridge Dr
- 1072 Thrasher Ct Unit 2
- 0 Riva Ridge Ln NW Unit 8832367
- 5347 Riva Ridge Ln
- 5348 Riva Ridge Ln
- 979 Riva Ridge Dr