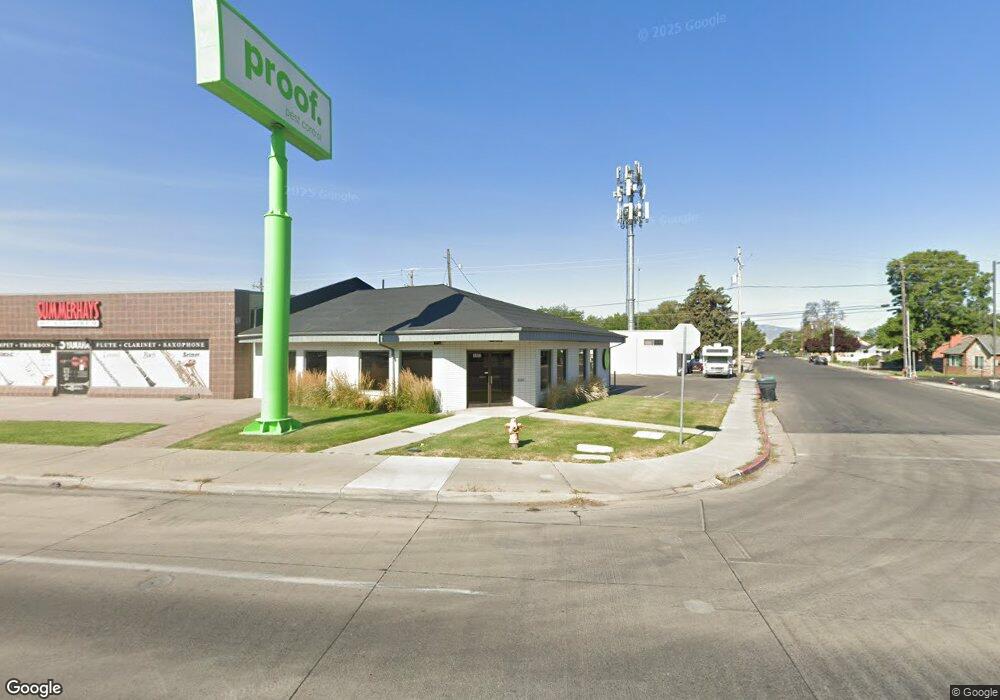
1002 S State St Orem, UT 84097
Westmore NeighborhoodEstimated Value: $807,772
Studio
--
Bath
2,099
Sq Ft
$385/Sq Ft
Est. Value
About This Home
This home is located at 1002 S State St, Orem, UT 84097 and is currently estimated at $807,772, approximately $384 per square foot. 1002 S State St is a home located in Utah County with nearby schools including Westmore Elementary School, Lakeridge Jr High School, and Mountain View High School.
Ownership History
Date
Name
Owned For
Owner Type
Purchase Details
Closed on
Nov 30, 2020
Sold by
Imperial Insurance Services Llc
Bought by
Jamb Holdings Llc
Current Estimated Value
Purchase Details
Closed on
Nov 13, 2018
Sold by
Imperial Insurance Service
Bought by
Imperial Insurance Services Llc
Home Financials for this Owner
Home Financials are based on the most recent Mortgage that was taken out on this home.
Original Mortgage
$225,000
Interest Rate
4.7%
Mortgage Type
Commercial
Create a Home Valuation Report for This Property
The Home Valuation Report is an in-depth analysis detailing your home's value as well as a comparison with similar homes in the area
Home Values in the Area
Average Home Value in this Area
Purchase History
| Date | Buyer | Sale Price | Title Company |
|---|---|---|---|
| Jamb Holdings Llc | -- | Metro Title And Escrow | |
| Imperial Insurance Services Llc | -- | Inwest Title Services Inc |
Source: Public Records
Mortgage History
| Date | Status | Borrower | Loan Amount |
|---|---|---|---|
| Previous Owner | Imperial Insurance Services Llc | $225,000 |
Source: Public Records
Tax History
| Year | Tax Paid | Tax Assessment Tax Assessment Total Assessment is a certain percentage of the fair market value that is determined by local assessors to be the total taxable value of land and additions on the property. | Land | Improvement |
|---|---|---|---|---|
| 2025 | $4,342 | $528,000 | $171,500 | $356,500 |
| 2024 | $4,342 | $530,900 | $0 | $0 |
| 2023 | $4,294 | $564,300 | $0 | $0 |
| 2022 | $3,497 | $445,200 | $151,600 | $293,600 |
| 2021 | $4,080 | $432,719 | $127,800 | $304,919 |
| 2020 | $3,859 | $402,300 | $127,800 | $274,500 |
| 2019 | $3,673 | $398,200 | $122,900 | $275,300 |
| 2018 | $3,313 | $343,100 | $116,300 | $226,800 |
| 2017 | $3,163 | $319,100 | $0 | $0 |
| 2016 | $3,466 | $322,400 | $0 | $0 |
| 2015 | $3,476 | $305,800 | $0 | $0 |
| 2014 | $3,428 | $300,200 | $0 | $0 |
Source: Public Records
Map
Nearby Homes
Your Personal Tour Guide
Ask me questions while you tour the home.