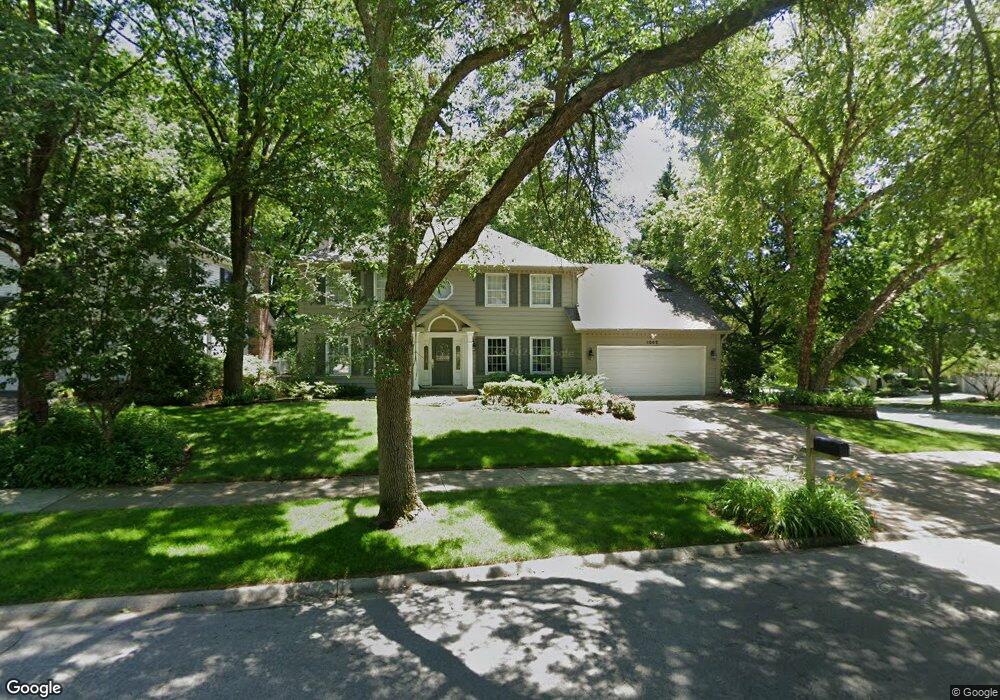
1002 Shimer Ct Naperville, IL 60565
Walnut Ridge NeighborhoodEstimated Value: $772,516 - $806,000
5
Beds
3
Baths
2,854
Sq Ft
$277/Sq Ft
Est. Value
About This Home
This home is located at 1002 Shimer Ct, Naperville, IL 60565 and is currently estimated at $791,129, approximately $277 per square foot. 1002 Shimer Ct is a home located in Will County with nearby schools including River Woods Elementary School, Madison Jr High School, and Naperville Central High School.
Ownership History
Date
Name
Owned For
Owner Type
Purchase Details
Closed on
Jul 5, 2017
Sold by
Levy Joyce A and Joyce A Levy Living Trust
Bought by
Doyle Jeffrey and Doyle Catherine
Current Estimated Value
Home Financials for this Owner
Home Financials are based on the most recent Mortgage that was taken out on this home.
Original Mortgage
$374,400
Outstanding Balance
$311,490
Interest Rate
3.94%
Mortgage Type
New Conventional
Estimated Equity
$479,639
Purchase Details
Closed on
Jul 7, 2014
Sold by
Levy Joyce A
Bought by
Levy Joyce A and Joyce A Levy Living Trust
Purchase Details
Closed on
Jul 22, 2009
Sold by
Levy Robert A and Levy Joyce A
Bought by
Levy Joyce A
Purchase Details
Closed on
Dec 1, 1986
Bought by
Levy Joyce A
Create a Home Valuation Report for This Property
The Home Valuation Report is an in-depth analysis detailing your home's value as well as a comparison with similar homes in the area
Home Values in the Area
Average Home Value in this Area
Purchase History
| Date | Buyer | Sale Price | Title Company |
|---|---|---|---|
| Doyle Jeffrey | $468,000 | Fidelity Title | |
| Levy Joyce A | -- | None Available | |
| Levy Joyce A | -- | None Available | |
| Levy Joyce A | $191,400 | -- |
Source: Public Records
Mortgage History
| Date | Status | Borrower | Loan Amount |
|---|---|---|---|
| Open | Doyle Jeffrey | $374,400 |
Source: Public Records
Tax History
| Year | Tax Paid | Tax Assessment Tax Assessment Total Assessment is a certain percentage of the fair market value that is determined by local assessors to be the total taxable value of land and additions on the property. | Land | Improvement |
|---|---|---|---|---|
| 2024 | $13,595 | $218,710 | $53,405 | $165,305 |
| 2023 | $13,595 | $196,788 | $48,052 | $148,736 |
| 2022 | $11,791 | $177,414 | $43,321 | $134,093 |
| 2021 | $11,005 | $165,885 | $40,506 | $125,379 |
| 2020 | $11,169 | $168,874 | $41,236 | $127,638 |
| 2019 | $10,787 | $160,832 | $39,272 | $121,560 |
| 2018 | $10,296 | $153,936 | $37,588 | $116,348 |
| 2017 | $9,715 | $143,110 | $35,628 | $107,482 |
| 2016 | $9,899 | $143,400 | $35,700 | $107,700 |
| 2015 | $9,805 | $137,500 | $34,200 | $103,300 |
| 2014 | $9,805 | $137,500 | $34,200 | $103,300 |
| 2013 | $9,805 | $133,500 | $33,200 | $100,300 |
Source: Public Records
Map
Nearby Homes
- 1120 Colgate Ct
- 2230 Keim Rd Unit 3B
- 2250 Lisson Rd
- 25 W 500 Royce Rd
- 805 Potomac Ave
- 4 Pennsbury Ct
- 818 Wescott Rd
- 716 Ayers St
- 2697 Fox River Ln
- VACANT W Boughton Rd
- 1406 River Oak Dr
- 15 Pinnacle Ct
- 44 Oak Bluff Ct
- 36 Oak Bluff Ct
- 425 Carriage Hill Rd
- 556 Pontiac Ln Unit 5
- 261 Bryant Way
- 181 Hillside Dr Unit 2
- 51 Ford Ln
- 517 Sheffield Rd