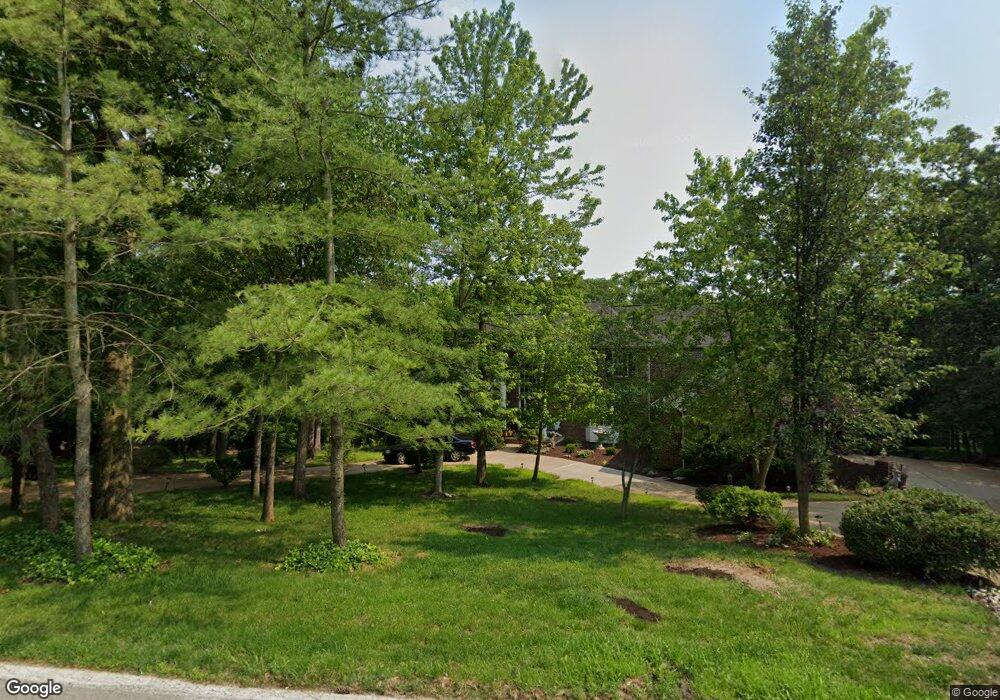
10022 Bauer Rd Saint Louis, MO 63128
Estimated Value: $981,717 - $1,030,000
3
Beds
5
Baths
6,198
Sq Ft
$161/Sq Ft
Est. Value
About This Home
This home is located at 10022 Bauer Rd, Saint Louis, MO 63128 and is currently estimated at $997,429, approximately $160 per square foot. 10022 Bauer Rd is a home located in St. Louis County with nearby schools including Hagemann Elementary School, Washington Middle School, and Mehlville High School.
Ownership History
Date
Name
Owned For
Owner Type
Purchase Details
Closed on
Oct 9, 2025
Sold by
Tacke Melanie
Bought by
Piening Trust and Piening
Current Estimated Value
Purchase Details
Closed on
Aug 22, 2019
Sold by
Tacke John L and Tacke Melanie
Bought by
Tacke John L and Tacke Melanie
Home Financials for this Owner
Home Financials are based on the most recent Mortgage that was taken out on this home.
Original Mortgage
$300,000
Interest Rate
3.8%
Mortgage Type
New Conventional
Purchase Details
Closed on
Aug 21, 2019
Sold by
Lammert Stacey and Lammert Andy
Bought by
Tacke John L and Tacke Melanie
Home Financials for this Owner
Home Financials are based on the most recent Mortgage that was taken out on this home.
Original Mortgage
$300,000
Interest Rate
3.8%
Mortgage Type
New Conventional
Purchase Details
Closed on
Sep 15, 1997
Sold by
Mcclanahan Virgil D and Mcclanahan Harriett G
Bought by
Tacke John L
Create a Home Valuation Report for This Property
The Home Valuation Report is an in-depth analysis detailing your home's value as well as a comparison with similar homes in the area
Home Values in the Area
Average Home Value in this Area
Purchase History
| Date | Buyer | Sale Price | Title Company |
|---|---|---|---|
| Piening Trust | -- | Investors Title Company | |
| Tacke John L | -- | Orntic St Louis | |
| Tacke John L | -- | Old Republic Natl Ttl Ins Co | |
| Tacke John L | -- | -- |
Source: Public Records
Mortgage History
| Date | Status | Borrower | Loan Amount |
|---|---|---|---|
| Previous Owner | Tacke John L | $300,000 |
Source: Public Records
Tax History Compared to Growth
Tax History
| Year | Tax Paid | Tax Assessment Tax Assessment Total Assessment is a certain percentage of the fair market value that is determined by local assessors to be the total taxable value of land and additions on the property. | Land | Improvement |
|---|---|---|---|---|
| 2025 | $11,039 | $182,820 | $23,140 | $159,680 |
| 2024 | $11,039 | $165,150 | $20,370 | $144,780 |
| 2023 | $11,039 | $165,150 | $20,370 | $144,780 |
| 2022 | $9,237 | $140,680 | $14,820 | $125,860 |
| 2021 | $8,938 | $140,680 | $14,820 | $125,860 |
| 2020 | $9,426 | $141,150 | $15,370 | $125,780 |
| 2019 | $9,398 | $141,150 | $15,370 | $125,780 |
| 2018 | $9,886 | $134,090 | $12,830 | $121,260 |
| 2017 | $9,872 | $134,090 | $12,830 | $121,260 |
| 2016 | $9,784 | $127,510 | $12,830 | $114,680 |
| 2015 | $8,977 | $127,510 | $12,830 | $114,680 |
| 2014 | $8,334 | $117,160 | $7,240 | $109,920 |
Source: Public Records
Map
Nearby Homes
- 5325 Tesson Gardens Ct
- 5333 Tesson Ct
- 5334 Tesson Ct
- 5374 Tesson Ct
- 4947 Butler Hill Rd
- 10016 Schuessler Rd
- 5507 Elk Valley Estates Dr
- 5100 Tesson Gardens Ct Unit 3C
- 10336 Bauer Rd
- 5512 & 5516 Elk Valley Estates Dr
- 5263 Faro Dr
- 5135 Towne Centre Dr
- 5317 Hamlin Ct
- 5100 Melitta Dr
- 13232 East Ln
- 5401 Green Cedar Way Unit 6
- 5102 Peyton Place Ct
- 5057 Peyton Place Ct
- 13266 East Ln
- 13372 Bahnfyre Dr
- 10021 Bauer Rd
- 10015 Bauer Rd
- 10040 Bauer Rd
- 10001 Bauer Rd
- 10027 Bauer Rd
- 10033 Bauer Rd
- 10041 Bauer Rd
- 10048 Bauer Rd
- 5307 Keller Rd
- 12827 Sarah Ann Ct
- 10038 Canterbury Farms Ct
- 10049 Bauer Rd
- 10032 Canterbury Farms Ct
- 10058 Bauer Rd
- 12819 Sarah Ann Ct
- 10044 Canterbury Farms Ct
- 10026 Canterbury Farms Ct
- 10057 Bauer Rd
- 12826 Sarah Ann Ct
- 13501 Chatham Manor Dr