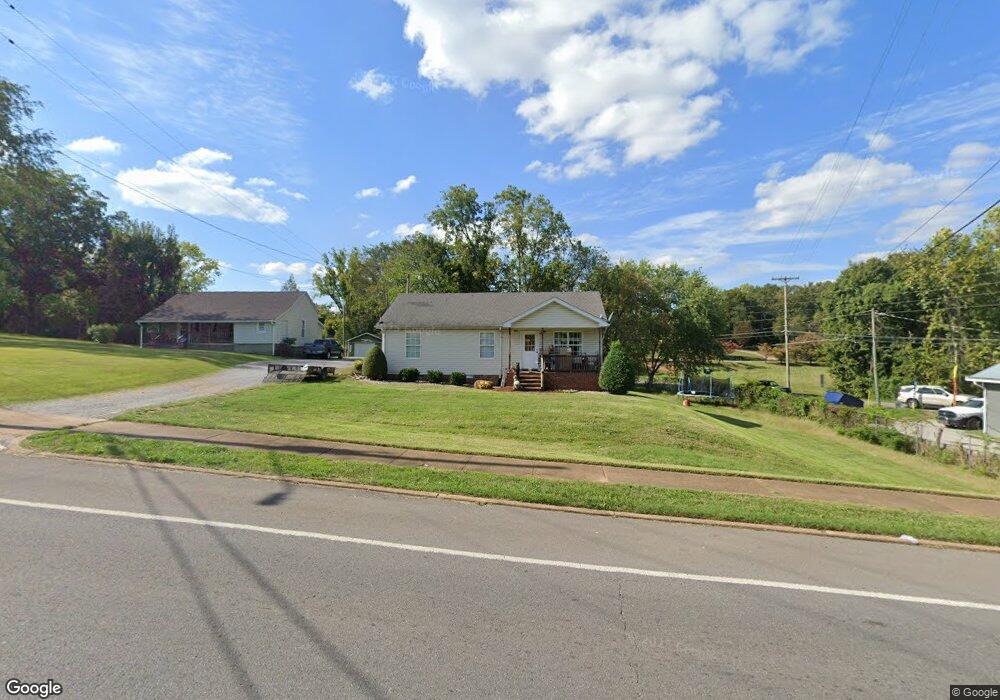
1003 5th Ave W Springfield, TN 37172
Estimated Value: $244,000 - $272,000
--
Bed
2
Baths
1,120
Sq Ft
$230/Sq Ft
Est. Value
About This Home
This home is located at 1003 5th Ave W, Springfield, TN 37172 and is currently estimated at $257,728, approximately $230 per square foot. 1003 5th Ave W is a home located in Robertson County with nearby schools including Westside Elementary School, Cheatham Park Elementary School, and Jo Byrns High School.
Ownership History
Date
Name
Owned For
Owner Type
Purchase Details
Closed on
Apr 12, 2007
Sold by
Thompson Darrell W and Thompson Melin
Bought by
Sneed Henry Clay
Current Estimated Value
Home Financials for this Owner
Home Financials are based on the most recent Mortgage that was taken out on this home.
Original Mortgage
$52,000
Interest Rate
6.1%
Purchase Details
Closed on
Sep 19, 2006
Sold by
Carter Margaret O
Bought by
Thompson Darrell W and Thompson Melinda G
Home Financials for this Owner
Home Financials are based on the most recent Mortgage that was taken out on this home.
Original Mortgage
$52,000
Interest Rate
6.46%
Purchase Details
Closed on
Oct 14, 1992
Bought by
Carter Clarence and Carter Margaret O
Purchase Details
Closed on
Sep 26, 1972
Bought by
Carter Roger D
Create a Home Valuation Report for This Property
The Home Valuation Report is an in-depth analysis detailing your home's value as well as a comparison with similar homes in the area
Home Values in the Area
Average Home Value in this Area
Purchase History
| Date | Buyer | Sale Price | Title Company |
|---|---|---|---|
| Sneed Henry Clay | $65,000 | -- | |
| Thompson Darrell W | $65,000 | -- | |
| Carter Clarence | $20,000 | -- | |
| Carter Roger D | -- | -- |
Source: Public Records
Mortgage History
| Date | Status | Borrower | Loan Amount |
|---|---|---|---|
| Closed | Carter Roger D | $52,000 | |
| Previous Owner | Carter Roger D | $52,000 |
Source: Public Records
Tax History Compared to Growth
Tax History
| Year | Tax Paid | Tax Assessment Tax Assessment Total Assessment is a certain percentage of the fair market value that is determined by local assessors to be the total taxable value of land and additions on the property. | Land | Improvement |
|---|---|---|---|---|
| 2024 | -- | $54,350 | $16,250 | $38,100 |
| 2023 | $1,361 | $54,350 | $16,250 | $38,100 |
| 2022 | $1,146 | $31,425 | $5,500 | $25,925 |
| 2021 | $1,146 | $31,425 | $5,500 | $25,925 |
| 2020 | $1,146 | $31,425 | $5,500 | $25,925 |
| 2019 | $34,509 | $31,425 | $5,500 | $25,925 |
| 2018 | $1,146 | $31,425 | $5,500 | $25,925 |
| 2017 | $1,093 | $25,500 | $3,775 | $21,725 |
| 2016 | $1,093 | $25,500 | $3,775 | $21,725 |
| 2015 | $1,061 | $25,500 | $3,775 | $21,725 |
| 2014 | $1,061 | $25,500 | $3,775 | $21,725 |
Source: Public Records
Map
Nearby Homes