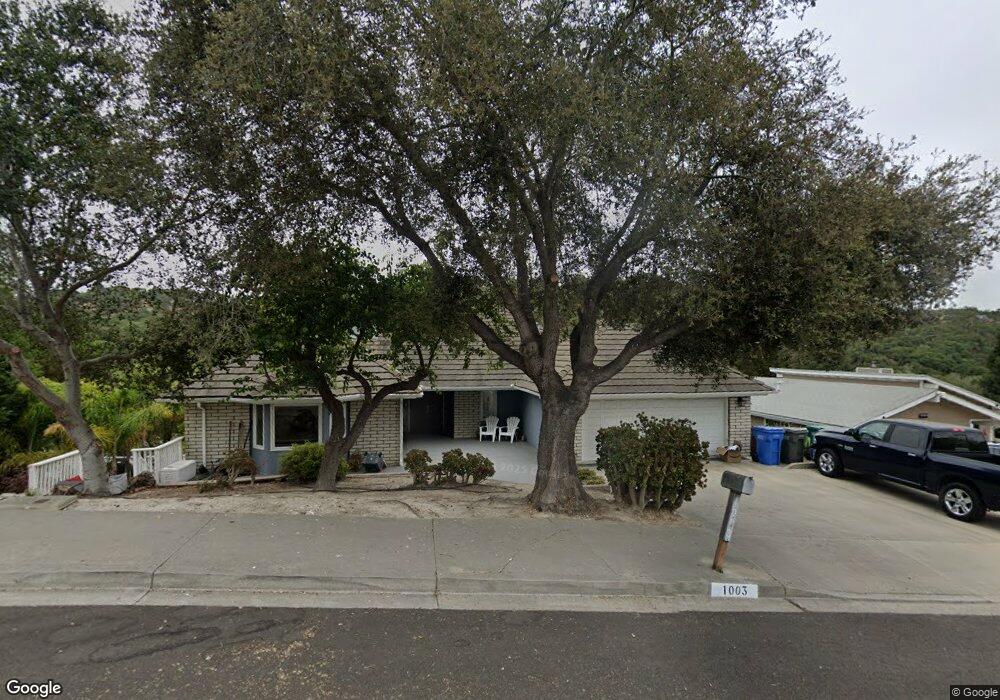
1003 Acorn Dr Arroyo Grande, CA 93420
Estimated Value: $1,423,000 - $1,721,000
4
Beds
4
Baths
3,728
Sq Ft
$426/Sq Ft
Est. Value
About This Home
This home is located at 1003 Acorn Dr, Arroyo Grande, CA 93420 and is currently estimated at $1,586,435, approximately $425 per square foot. 1003 Acorn Dr is a home located in San Luis Obispo County with nearby schools including Ocean View Elementary School, Judkins Middle School, and Arroyo Grande High School.
Ownership History
Date
Name
Owned For
Owner Type
Purchase Details
Closed on
Nov 1, 2010
Sold by
Nordstrom Michael N and Nordstrom Sandra D
Bought by
Koester Jeff R and Koester Desiree R
Current Estimated Value
Home Financials for this Owner
Home Financials are based on the most recent Mortgage that was taken out on this home.
Original Mortgage
$545,000
Outstanding Balance
$359,583
Interest Rate
4.27%
Mortgage Type
Seller Take Back
Estimated Equity
$1,226,852
Purchase Details
Closed on
Oct 17, 2008
Sold by
Nordstrom Michael N and Nordstrom Sandra D
Bought by
Nordstrom Michael N and Nordstrom Sandra D
Purchase Details
Closed on
Aug 19, 2004
Sold by
Cezar Robert M and Cezar Dianne
Bought by
Nordstrom Michael N and Nordstrom Sandra D
Home Financials for this Owner
Home Financials are based on the most recent Mortgage that was taken out on this home.
Original Mortgage
$333,700
Interest Rate
5.94%
Mortgage Type
Purchase Money Mortgage
Create a Home Valuation Report for This Property
The Home Valuation Report is an in-depth analysis detailing your home's value as well as a comparison with similar homes in the area
Home Values in the Area
Average Home Value in this Area
Purchase History
| Date | Buyer | Sale Price | Title Company |
|---|---|---|---|
| Koester Jeff R | $600,000 | First American Title Company | |
| Nordstrom Michael N | -- | None Available | |
| Nordstrom Michael N | $700,000 | Chicago Title Company |
Source: Public Records
Mortgage History
| Date | Status | Borrower | Loan Amount |
|---|---|---|---|
| Open | Koester Jeff R | $545,000 | |
| Previous Owner | Nordstrom Michael N | $333,700 | |
| Closed | Nordstrom Michael N | $150,000 |
Source: Public Records
Tax History Compared to Growth
Tax History
| Year | Tax Paid | Tax Assessment Tax Assessment Total Assessment is a certain percentage of the fair market value that is determined by local assessors to be the total taxable value of land and additions on the property. | Land | Improvement |
|---|---|---|---|---|
| 2025 | $7,952 | $768,693 | $243,416 | $525,277 |
| 2024 | $7,860 | $753,622 | $238,644 | $514,978 |
| 2023 | $7,860 | $738,846 | $233,965 | $504,881 |
| 2022 | $7,742 | $724,360 | $229,378 | $494,982 |
| 2021 | $7,727 | $710,158 | $224,881 | $485,277 |
| 2020 | $7,638 | $702,878 | $222,576 | $480,302 |
| 2019 | $7,583 | $689,097 | $218,212 | $470,885 |
| 2018 | $7,493 | $675,586 | $213,934 | $461,652 |
| 2017 | $7,369 | $662,340 | $209,740 | $452,600 |
| 2016 | $6,961 | $649,354 | $205,628 | $443,726 |
| 2015 | $6,903 | $639,601 | $202,540 | $437,061 |
| 2014 | $6,653 | $627,073 | $198,573 | $428,500 |
Source: Public Records
Map
Nearby Homes
- 579 Camino Mercado Unit 305
- 1057 Meadow Way
- 1024 Robin Cir
- 758 Via Bandolero
- 282 Robles Rd Unit 19
- 277 Hillcrest Dr Unit 13
- 413 Via Bandolero
- 0 N Oak Park Blvd
- 249 Margo Way
- 117 Village Cir
- 1566 Hillcrest Dr
- 553 Rosemary Ln
- 108 Marian Way
- 334 Corona Del Terra
- 234 Christine Way
- 910 N 12th St
- 1950 Newport Ave
- 280 Chelsea Ct
- 182 Fair View Dr
- 1773 Newport Ave