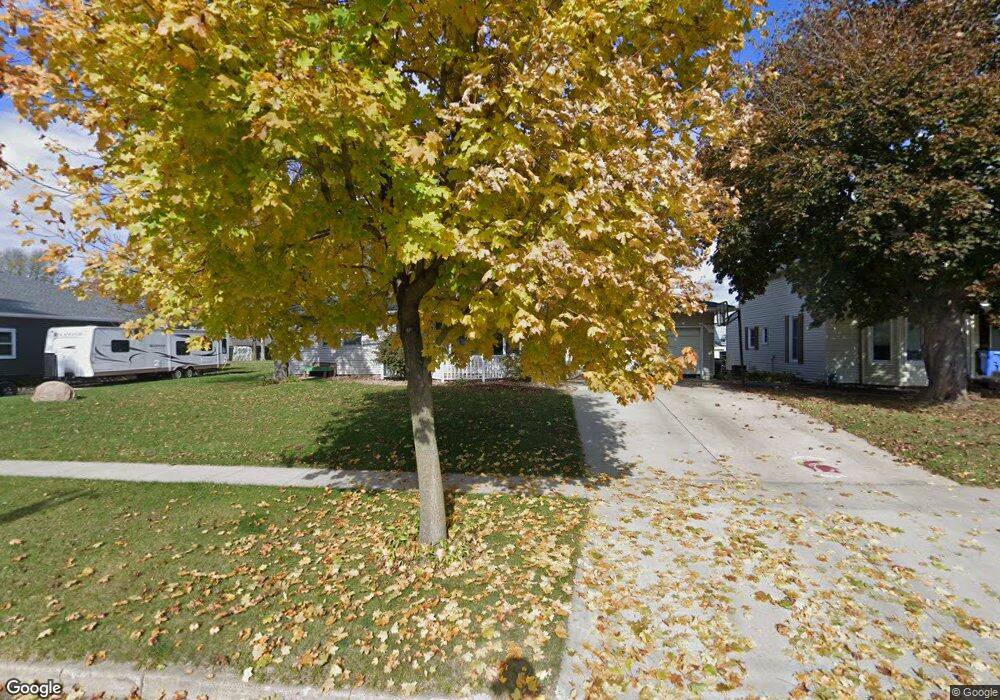
1003 I Ave Grundy Center, IA 50638
Estimated Value: $225,000 - $259,430
4
Beds
3
Baths
1,516
Sq Ft
$157/Sq Ft
Est. Value
About This Home
This home is located at 1003 I Ave, Grundy Center, IA 50638 and is currently estimated at $237,858, approximately $156 per square foot. 1003 I Ave is a home with nearby schools including Grundy Center Elementary School and Grundy Center High School.
Ownership History
Date
Name
Owned For
Owner Type
Purchase Details
Closed on
Dec 6, 2024
Sold by
Schmidt Dana C and Schmidt Danielle J
Bought by
Bunkers Brandon John and Bunkers Emery Anna
Current Estimated Value
Home Financials for this Owner
Home Financials are based on the most recent Mortgage that was taken out on this home.
Original Mortgage
$245,160
Outstanding Balance
$243,012
Interest Rate
6.79%
Mortgage Type
VA
Estimated Equity
-$5,154
Purchase Details
Closed on
Aug 18, 2017
Sold by
Schuller John F and Schuller Joan M
Bought by
Schmidt Dana C and Schmidt Danielle J
Home Financials for this Owner
Home Financials are based on the most recent Mortgage that was taken out on this home.
Original Mortgage
$120,000
Interest Rate
3.96%
Mortgage Type
New Conventional
Create a Home Valuation Report for This Property
The Home Valuation Report is an in-depth analysis detailing your home's value as well as a comparison with similar homes in the area
Home Values in the Area
Average Home Value in this Area
Purchase History
| Date | Buyer | Sale Price | Title Company |
|---|---|---|---|
| Bunkers Brandon John | $240,000 | None Listed On Document | |
| Bunkers Brandon John | $240,000 | None Listed On Document | |
| Schmidt Dana C | -- | None Available |
Source: Public Records
Mortgage History
| Date | Status | Borrower | Loan Amount |
|---|---|---|---|
| Open | Bunkers Brandon John | $245,160 | |
| Closed | Bunkers Brandon John | $245,160 | |
| Previous Owner | Schmidt Dana C | $120,000 |
Source: Public Records
Tax History Compared to Growth
Tax History
| Year | Tax Paid | Tax Assessment Tax Assessment Total Assessment is a certain percentage of the fair market value that is determined by local assessors to be the total taxable value of land and additions on the property. | Land | Improvement |
|---|---|---|---|---|
| 2025 | $3,544 | $234,700 | $14,400 | $220,300 |
| 2024 | $3,544 | $204,690 | $14,400 | $190,290 |
| 2023 | $3,586 | $204,690 | $14,400 | $190,290 |
| 2022 | $3,288 | $168,000 | $12,600 | $155,400 |
| 2021 | $3,288 | $168,000 | $12,600 | $155,400 |
| 2020 | $2,890 | $159,760 | $12,600 | $147,160 |
| 2019 | $2,810 | $159,760 | $12,600 | $147,160 |
| 2018 | $2,776 | $149,680 | $12,600 | $137,080 |
| 2017 | $2,702 | $149,680 | $12,600 | $137,080 |
| 2016 | $2,702 | $0 | $0 | $0 |
| 2015 | $2,702 | $0 | $0 | $0 |
| 2014 | $1,836 | $0 | $0 | $0 |
Source: Public Records
Map
Nearby Homes