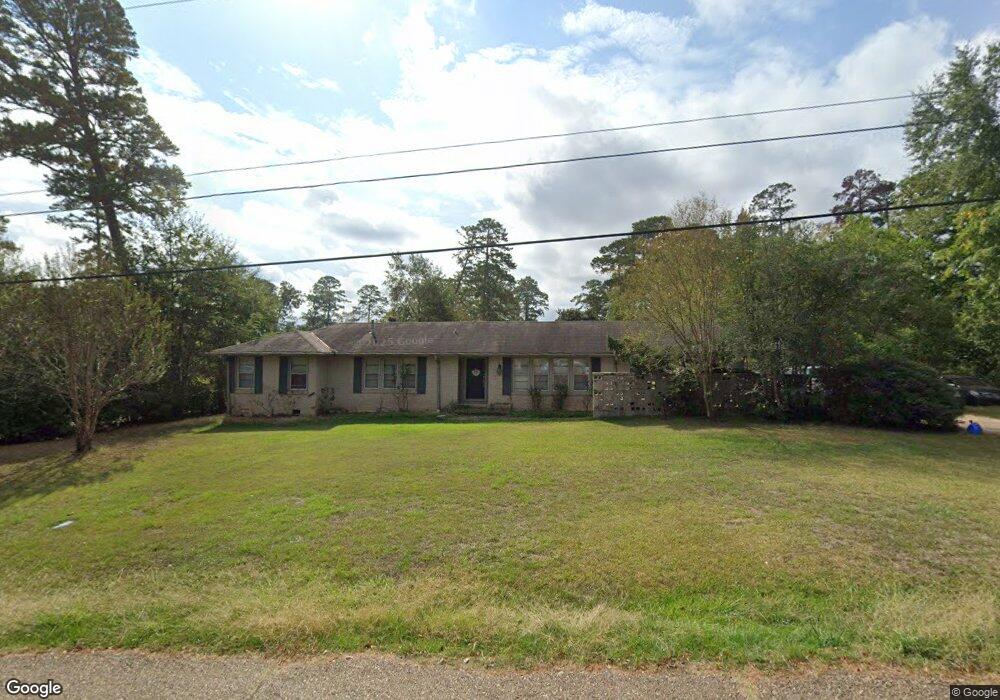
1003 Lee Ave Ruston, LA 71270
Estimated Value: $215,000 - $246,000
3
Beds
2
Baths
2,791
Sq Ft
$81/Sq Ft
Est. Value
About This Home
This home is located at 1003 Lee Ave, Ruston, LA 71270 and is currently estimated at $225,019, approximately $80 per square foot. 1003 Lee Ave is a home located in Lincoln Parish with nearby schools including Glen View Elementary School, Cypress Springs Elementary School, and Ruston Junior High School.
Ownership History
Date
Name
Owned For
Owner Type
Purchase Details
Closed on
Aug 27, 2012
Sold by
Choate Britt K
Bought by
Neview Megan M
Current Estimated Value
Home Financials for this Owner
Home Financials are based on the most recent Mortgage that was taken out on this home.
Original Mortgage
$135,876
Outstanding Balance
$92,332
Interest Rate
3.57%
Mortgage Type
Unknown
Estimated Equity
$132,687
Purchase Details
Closed on
Oct 22, 2010
Sold by
Lee Avenue Llc
Bought by
Powdrill Choate Britt K and Powdrill Choate Joni
Home Financials for this Owner
Home Financials are based on the most recent Mortgage that was taken out on this home.
Original Mortgage
$122,660
Interest Rate
4.38%
Mortgage Type
Unknown
Purchase Details
Closed on
Apr 4, 2007
Sold by
Tripp & Diane Llc
Bought by
Lee Avenue Llc
Home Financials for this Owner
Home Financials are based on the most recent Mortgage that was taken out on this home.
Original Mortgage
$94,500
Interest Rate
6.24%
Mortgage Type
Purchase Money Mortgage
Create a Home Valuation Report for This Property
The Home Valuation Report is an in-depth analysis detailing your home's value as well as a comparison with similar homes in the area
Purchase History
| Date | Buyer | Sale Price | Title Company |
|---|---|---|---|
| Neview Megan M | $135,000 | None Available | |
| Powdrill Choate Britt K | $120,000 | None Available | |
| Lee Avenue Llc | $105,000 | None Available |
Source: Public Records
Mortgage History
| Date | Status | Borrower | Loan Amount |
|---|---|---|---|
| Open | Neview Megan M | $135,876 | |
| Previous Owner | Powdrill Choate Britt K | $122,660 | |
| Previous Owner | Lee Avenue Llc | $94,500 |
Source: Public Records
Tax History
| Year | Tax Paid | Tax Assessment Tax Assessment Total Assessment is a certain percentage of the fair market value that is determined by local assessors to be the total taxable value of land and additions on the property. | Land | Improvement |
|---|---|---|---|---|
| 2025 | $1,593 | $18,658 | $2,419 | $16,239 |
| 2024 | $1,593 | $18,659 | $2,419 | $16,240 |
| 2023 | $1,744 | $19,625 | $3,386 | $16,239 |
| 2022 | $1,753 | $19,625 | $3,386 | $16,239 |
| 2021 | $1,623 | $19,626 | $3,386 | $16,240 |
| 2020 | $1,459 | $17,559 | $3,386 | $14,173 |
| 2019 | $1,426 | $17,559 | $3,386 | $14,173 |
| 2018 | $1,387 | $17,559 | $3,386 | $14,173 |
| 2017 | $1,391 | $17,559 | $3,386 | $14,173 |
| 2016 | $1,385 | $0 | $0 | $0 |
| 2015 | $1,237 | $14,402 | $2,709 | $11,693 |
| 2013 | $1,256 | $14,402 | $2,709 | $11,693 |
Source: Public Records
Map
Nearby Homes
- 902 Arnold St
- 1201 Gains Ave
- 1322 Cooktown Rd
- 316 Western St Unit 314 Western Street,
- 0 Gordon Dr
- 709 W Georgia Ave
- 904 Sherwood Dr
- 516 Glendale Dr
- 509 N Trenton St
- Lot 10 King Estate Ln
- 504 N Trenton St
- 910 N Vienna St
- 1604 N Trenton St
- 1607 N Trenton St
- 1715 N Trenton St
- 000 Louisiana 150
- 500 N Bonner St
- 218 Huey Ave
- 2158 Llangeler Dr
- 0 E Florida Ave
Your Personal Tour Guide
Ask me questions while you tour the home.