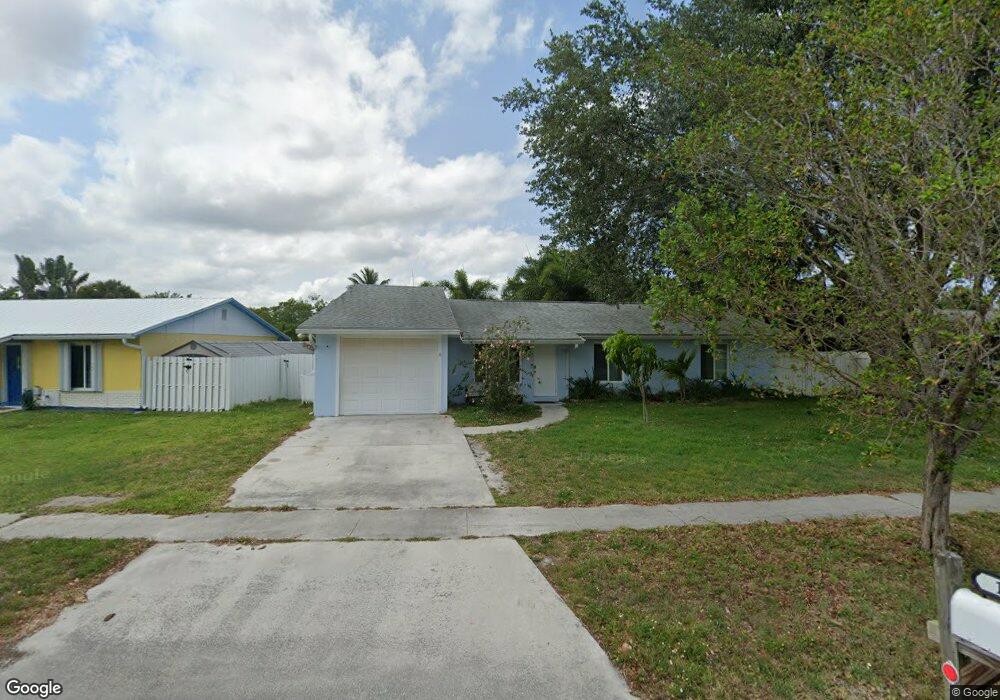
1003 Mohawk St Jupiter, FL 33458
Jupiter River NeighborhoodEstimated Value: $532,156 - $571,000
3
Beds
1
Bath
1,260
Sq Ft
$435/Sq Ft
Est. Value
About This Home
This home is located at 1003 Mohawk St, Jupiter, FL 33458 and is currently estimated at $548,289, approximately $435 per square foot. 1003 Mohawk St is a home located in Palm Beach County with nearby schools including Jerry Thomas Elementary School, Independence Middle School, and Jupiter High School.
Ownership History
Date
Name
Owned For
Owner Type
Purchase Details
Closed on
Dec 21, 2020
Sold by
Gens Rental Properties Llc
Bought by
Andrassy Robert and Andrassy Briana
Current Estimated Value
Home Financials for this Owner
Home Financials are based on the most recent Mortgage that was taken out on this home.
Original Mortgage
$328,500
Outstanding Balance
$291,651
Interest Rate
2.8%
Mortgage Type
New Conventional
Estimated Equity
$256,638
Purchase Details
Closed on
Jun 18, 2020
Sold by
Cox Patricia L
Bought by
Gens Rental Properties Llc
Purchase Details
Closed on
Jun 3, 1997
Sold by
Hursey Steven A and Hursey Dawn
Bought by
Cox Harold A and Cox Patricia L
Home Financials for this Owner
Home Financials are based on the most recent Mortgage that was taken out on this home.
Original Mortgage
$81,000
Interest Rate
8.18%
Purchase Details
Closed on
Jun 13, 1995
Sold by
Palm Bch Commerce Cntr Assoc Ltd
Bought by
Palm Bch Ocean Studios Inc
Create a Home Valuation Report for This Property
The Home Valuation Report is an in-depth analysis detailing your home's value as well as a comparison with similar homes in the area
Home Values in the Area
Average Home Value in this Area
Purchase History
| Date | Buyer | Sale Price | Title Company |
|---|---|---|---|
| Andrassy Robert | $365,000 | Pegasus Title Services Llc | |
| Gens Rental Properties Llc | $200,000 | Pegasus Title Services Llc | |
| Cox Harold A | $90,000 | -- | |
| Palm Bch Ocean Studios Inc | $900,000 | -- |
Source: Public Records
Mortgage History
| Date | Status | Borrower | Loan Amount |
|---|---|---|---|
| Open | Andrassy Robert | $328,500 | |
| Previous Owner | Cox Harold A | $17,177 | |
| Previous Owner | Cox Harold A | $81,000 |
Source: Public Records
Tax History
| Year | Tax Paid | Tax Assessment Tax Assessment Total Assessment is a certain percentage of the fair market value that is determined by local assessors to be the total taxable value of land and additions on the property. | Land | Improvement |
|---|---|---|---|---|
| 2025 | $5,406 | $341,456 | -- | -- |
| 2024 | $5,406 | $331,833 | -- | -- |
| 2023 | $5,409 | $322,168 | $0 | $0 |
| 2022 | $5,063 | $312,784 | $0 | $0 |
| 2021 | $5,023 | $303,674 | $184,000 | $119,674 |
| 2020 | $1,657 | $119,884 | $0 | $0 |
| 2019 | $1,628 | $117,189 | $0 | $0 |
| 2018 | $1,537 | $115,004 | $0 | $0 |
| 2017 | $1,521 | $112,639 | $0 | $0 |
| 2016 | $1,870 | $110,322 | $0 | $0 |
| 2015 | $1,904 | $109,555 | $0 | $0 |
| 2014 | $1,921 | $108,686 | $0 | $0 |
Source: Public Records
Map
Nearby Homes
- 1212 Chickasaw St
- 1207 Choctaw St
- 1105 Cherokee St
- 207 Pennock Trace Dr
- 208 Jones Creek Dr
- 113 Caballo Ln
- 106 S Caloosahatchee Ave
- 1227 Cherokee St
- 107 Weomi Ln
- 104 Weomi Ln
- 305 Circle E
- 119 Hawksbill Way
- 149 Via Catalunha
- 133 Hawksbill Way
- 106 Micco Cir
- 195 Birkdale Ln
- 407 Georgian Park Dr
- 187 Birkdale Ln
- 106 Toteka Cir
- 185 Birkdale Ln
Your Personal Tour Guide
Ask me questions while you tour the home.