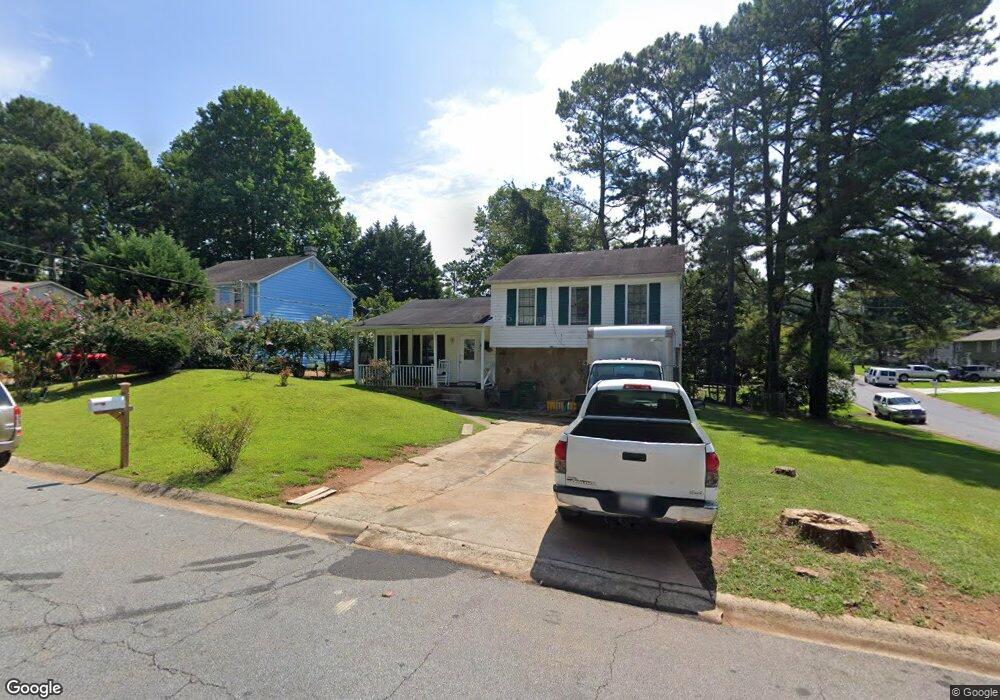
1003 Riva Ridge Dr Norcross, GA 30093
Estimated Value: $279,000 - $329,000
3
Beds
2
Baths
1,104
Sq Ft
$274/Sq Ft
Est. Value
About This Home
This home is located at 1003 Riva Ridge Dr, Norcross, GA 30093 and is currently estimated at $302,652, approximately $274 per square foot. 1003 Riva Ridge Dr is a home located in Gwinnett County with nearby schools including Lilburn Elementary School, Lilburn Middle School, and Meadowcreek High School.
Ownership History
Date
Name
Owned For
Owner Type
Purchase Details
Closed on
Apr 15, 2020
Sold by
Dia Oc Llc
Bought by
Better Atlanta Investments Llc
Current Estimated Value
Purchase Details
Closed on
Jul 5, 2007
Sold by
Bear Stearns Trust 2005-Sd4
Bought by
Nguyen Son
Purchase Details
Closed on
Nov 7, 2006
Sold by
Jimenez Silvia
Bought by
Bear Stearns Trust 2005-Sd4
Purchase Details
Closed on
Aug 15, 2003
Sold by
Guzman Donaciano and Guzman Lency
Bought by
Jimenez Silvia
Home Financials for this Owner
Home Financials are based on the most recent Mortgage that was taken out on this home.
Original Mortgage
$135,900
Interest Rate
6.24%
Mortgage Type
New Conventional
Purchase Details
Closed on
Feb 25, 1997
Sold by
Culpepper Shari J
Bought by
Guzman Donaciano
Create a Home Valuation Report for This Property
The Home Valuation Report is an in-depth analysis detailing your home's value as well as a comparison with similar homes in the area
Home Values in the Area
Average Home Value in this Area
Purchase History
| Date | Buyer | Sale Price | Title Company |
|---|---|---|---|
| Better Atlanta Investments Llc | -- | -- | |
| Nguyen Son | $98,000 | -- | |
| Bear Stearns Trust 2005-Sd4 | $113,535 | -- | |
| Jp Morgan Chase Bk | $113,535 | -- | |
| Jimenez Silvia | $135,900 | -- | |
| Guzman Donaciano | $83,400 | -- |
Source: Public Records
Mortgage History
| Date | Status | Borrower | Loan Amount |
|---|---|---|---|
| Previous Owner | Jimenez Silvia | $135,900 | |
| Closed | Guzman Donaciano | $0 |
Source: Public Records
Tax History Compared to Growth
Tax History
| Year | Tax Paid | Tax Assessment Tax Assessment Total Assessment is a certain percentage of the fair market value that is determined by local assessors to be the total taxable value of land and additions on the property. | Land | Improvement |
|---|---|---|---|---|
| 2025 | -- | $113,880 | $21,120 | $92,760 |
| 2024 | $4,183 | $107,600 | $21,120 | $86,480 |
| 2023 | $4,183 | $102,160 | $20,000 | $82,160 |
| 2022 | $2,653 | $90,320 | $14,000 | $76,320 |
| 2021 | $2,653 | $64,840 | $14,000 | $50,840 |
| 2020 | $0 | $64,840 | $14,000 | $50,840 |
| 2019 | $0 | $41,760 | $9,200 | $32,560 |
| 2018 | $1,758 | $41,760 | $9,200 | $32,560 |
| 2016 | $0 | $39,320 | $9,200 | $30,120 |
| 2015 | $1,349 | $29,240 | $6,000 | $23,240 |
| 2014 | -- | $29,240 | $6,000 | $23,240 |
Source: Public Records
Map
Nearby Homes
- 1066 Worcester Place NW Unit 4
- 5271 Williams Rd Unit A-1
- 5323 Sherwin Dr
- 5331 Sherwin Dr
- 5343 Sherwin Dr Unit 15
- 5333 Bishops Cir
- 5345 Seattle Slew Ct Unit 3
- 5181 Cold Springs Dr NW
- 1133 Sandune Dr
- 0 Harbins Rd NW Unit 7598091
- 5148 Whited Way NW Unit 1
- 5425 Village Green Square Unit 3
- 5431 Village Green Square Unit 1018
- 1013 Sandune Dr
- 5554 Clover Rise Ln Unit 2
- 5016 Comanche Ct NW
- 5622 Williamsburg Dr
- 5444 Wylstream
- 5384 Durham View Ct NW
- 5605 Rock Place Ct
- 1009 Riva Ridge Dr
- 1075 Mockingbird Trail Unit 1
- 991 Riva Ridge Dr
- 1015 Riva Ridge Dr
- 1072 Thrasher Ct Unit 2
- 1065 Mockingbird Trail
- 1065 Mockingbird Trail NW
- 1002 Riva Ridge Dr
- 1076 Mockingbird Trail
- 996 Riva Ridge Dr
- 1008 Riva Ridge Dr
- 1062 Thrasher Ct
- 990 Riva Ridge Dr
- 1066 Mockingbird Trail
- 1082 Thrasher Ct
- 1021 Riva Ridge Dr
- 985 Riva Ridge Dr
- 1014 Riva Ridge Dr
- 1055 Mockingbird Trail Unit 1
- 1052 Thrasher Ct