1003 W Main St Dahlgren, IL 62828
Estimated Value: $121,000 - $146,577
3
Beds
1
Bath
1,720
Sq Ft
$78/Sq Ft
Est. Value
About This Home
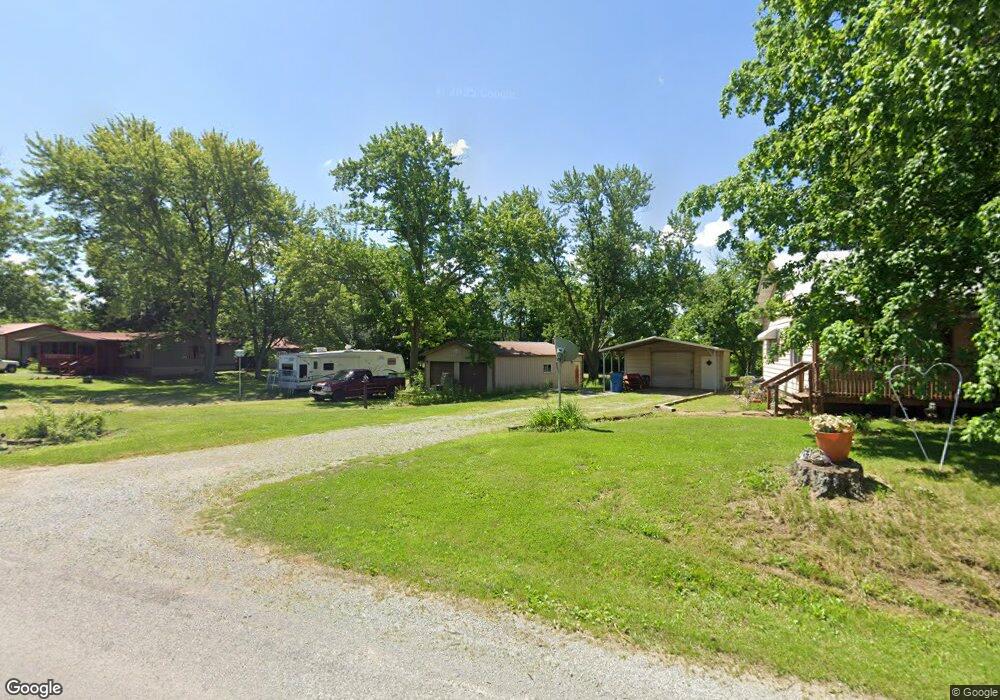
This home is located at 1003 W Main St, Dahlgren, IL 62828 and is currently estimated at $133,894, approximately $77 per square foot. 1003 W Main St is a home located in Hamilton County with nearby schools including Hamilton County Junior/Senior High School.
Ownership History
Date
Name
Owned For
Owner Type
Purchase Details
Closed on
Jun 28, 2022
Sold by
Mehalek Land Trust
Bought by
Mehalek Dorothy M
Current Estimated Value
Home Financials for this Owner
Home Financials are based on the most recent Mortgage that was taken out on this home.
Original Mortgage
$25,000
Outstanding Balance
$23,332
Interest Rate
5.25%
Mortgage Type
New Conventional
Estimated Equity
$110,562
Purchase Details
Closed on
Jan 13, 2021
Sold by
Lmo Llc
Bought by
Mehalek Rentals Llc
Purchase Details
Closed on
Sep 24, 2020
Sold by
Deutsche Bank National Trust Co
Bought by
Lmo Llc
Purchase Details
Closed on
Aug 24, 2011
Sold by
Baker Misty K and Shelton Misty K
Bought by
Shelton James Christian
Purchase Details
Closed on
Dec 15, 2006
Sold by
O'Neal Billy E
Bought by
Shelton James C and Shelton Misty K
Home Financials for this Owner
Home Financials are based on the most recent Mortgage that was taken out on this home.
Original Mortgage
$69,000
Interest Rate
11.84%
Mortgage Type
Adjustable Rate Mortgage/ARM
Create a Home Valuation Report for This Property
The Home Valuation Report is an in-depth analysis detailing your home's value as well as a comparison with similar homes in the area
Home Values in the Area
Average Home Value in this Area
Purchase History
| Date | Buyer | Sale Price | Title Company |
|---|---|---|---|
| Mehalek Dorothy M | $29,500 | None Listed On Document | |
| Mehalek Rentals Llc | $25,000 | None Available | |
| Lmo Llc | $13,000 | None Available | |
| Shelton James Christian | -- | None Available | |
| Shelton James C | $69,000 | None Available |
Source: Public Records
Mortgage History
| Date | Status | Borrower | Loan Amount |
|---|---|---|---|
| Open | Mehalek Dorothy M | $25,000 | |
| Previous Owner | Shelton James C | $69,000 |
Source: Public Records
Tax History Compared to Growth
Tax History
| Year | Tax Paid | Tax Assessment Tax Assessment Total Assessment is a certain percentage of the fair market value that is determined by local assessors to be the total taxable value of land and additions on the property. | Land | Improvement |
|---|---|---|---|---|
| 2024 | $1,104 | $24,265 | $2,573 | $21,692 |
| 2023 | $1,104 | $25,016 | $2,653 | $22,363 |
| 2022 | $1,489 | $23,445 | $2,486 | $20,959 |
| 2021 | $1,489 | $22,546 | $2,391 | $20,155 |
| 2020 | $1,057 | $21,228 | $2,251 | $18,977 |
| 2019 | $1,084 | $21,228 | $2,251 | $18,977 |
| 2018 | $1,121 | $15,228 | $2,251 | $12,977 |
| 2017 | $1,128 | $15,228 | $2,251 | $12,977 |
| 2015 | $1,152 | $15,365 | $2,265 | $13,100 |
| 2014 | $1,116 | $20,609 | $2,185 | $18,424 |
| 2013 | -- | $20,008 | $2,121 | $17,887 |
| 2012 | -- | $17,101 | $1,813 | $15,288 |
Source: Public Records
Map
Nearby Homes
- 602 S 4th St
- 000 Jacob St
- 000 E Lynchberg Rd
- 0 E Gun Creek Rd
- 18065 E Illinois Highway 142 Hwy
- 0000 Frisco Rd
- 17359 Log Cabin Rd
- 13840 N Dove Ln
- 4693 Illinois 14
- 17018 E Thompson Rd
- 0000 E North Ave
- 0000 4th St
- 0000 N Stanford Ln
- 000 275e
- 954 County Road 100 N
- 677 County Road 105 E
- 000 E Maple St
- 210 N Virginia St
- 601 W Cherry St
- 503 W Cherry St
- 1007 W Main St
- 908 W Main St
- 103 N Seventh St
- 808 W Main St
- 809 W Whited St
- 802 W Main St
- 801 W Whited St
- 708 W Main St
- 707 W Whited St
- 706 W Main St
- 112 N Seventh St
- 702 W Main St
- 701 W Whited St
- 208 N Seventh St
- 0000 No Address Available Rd
- 302 N 7th St
- 212 N 7th St
- 110 S Sixth St
- 285 County Road 2000 N
- 602 W Main St