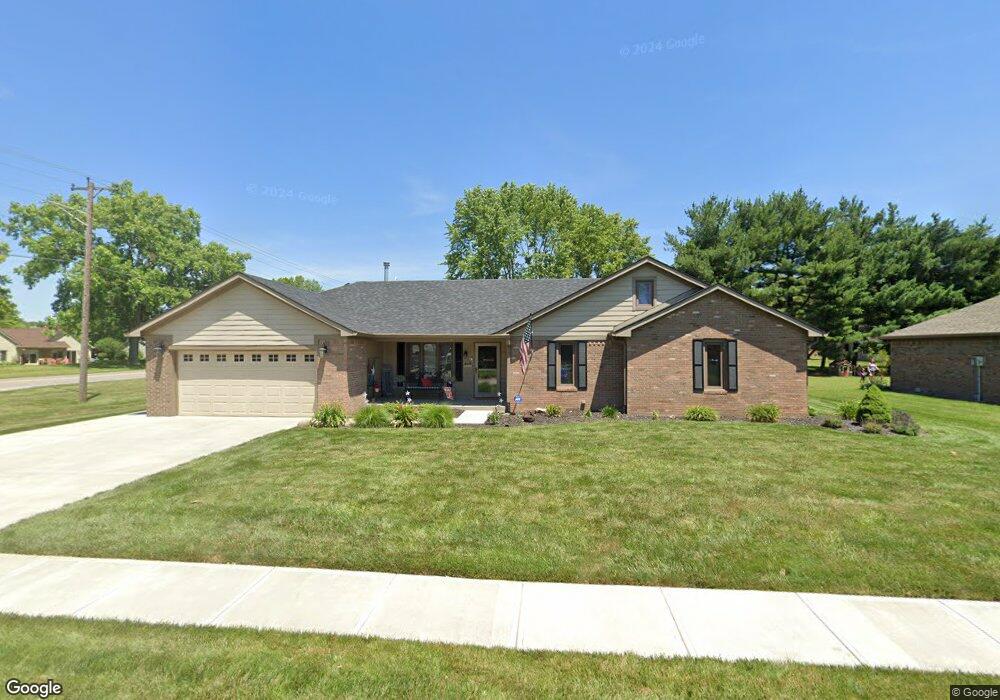
1004 Cedar Glen South Dr Plainfield, IN 46168
Estimated Value: $357,000 - $399,000
4
Beds
3
Baths
2,178
Sq Ft
$177/Sq Ft
Est. Value
About This Home
This home is located at 1004 Cedar Glen South Dr, Plainfield, IN 46168 and is currently estimated at $384,593, approximately $176 per square foot. 1004 Cedar Glen South Dr is a home located in Hendricks County with nearby schools including Van Buren Elementary School, Plainfield Community Middle School, and Plainfield High School.
Ownership History
Date
Name
Owned For
Owner Type
Purchase Details
Closed on
Sep 14, 2022
Sold by
Jones Shawn G and Jones Ann Nicole
Bought by
Waters Jeffrey T and Waters Lisa M
Current Estimated Value
Home Financials for this Owner
Home Financials are based on the most recent Mortgage that was taken out on this home.
Original Mortgage
$237,250
Outstanding Balance
$226,184
Interest Rate
4.99%
Mortgage Type
New Conventional
Estimated Equity
$158,409
Purchase Details
Closed on
Mar 28, 2008
Sold by
Murphy Dean W
Bought by
Jones Shawn G and Jones Nicole Ann
Home Financials for this Owner
Home Financials are based on the most recent Mortgage that was taken out on this home.
Original Mortgage
$216,500
Interest Rate
6.1%
Mortgage Type
FHA
Purchase Details
Closed on
Jun 9, 2006
Sold by
Sontag Scott B and Sontag Cheryl R
Bought by
Murphy Dean W
Home Financials for this Owner
Home Financials are based on the most recent Mortgage that was taken out on this home.
Original Mortgage
$207,500
Interest Rate
8.12%
Mortgage Type
Adjustable Rate Mortgage/ARM
Purchase Details
Closed on
Jun 9, 2005
Sold by
Murphy Dean W
Bought by
Jones Shawn and Jones Nicole
Create a Home Valuation Report for This Property
The Home Valuation Report is an in-depth analysis detailing your home's value as well as a comparison with similar homes in the area
Home Values in the Area
Average Home Value in this Area
Purchase History
| Date | Buyer | Sale Price | Title Company |
|---|---|---|---|
| Waters Jeffrey T | -- | -- | |
| Jones Shawn G | -- | None Available | |
| Murphy Dean W | -- | None Available | |
| Jones Shawn | -- | None Available |
Source: Public Records
Mortgage History
| Date | Status | Borrower | Loan Amount |
|---|---|---|---|
| Open | Waters Jeffrey T | $237,250 | |
| Previous Owner | Jones Shawn G | $216,500 | |
| Previous Owner | Murphy Dean W | $207,500 |
Source: Public Records
Tax History Compared to Growth
Tax History
| Year | Tax Paid | Tax Assessment Tax Assessment Total Assessment is a certain percentage of the fair market value that is determined by local assessors to be the total taxable value of land and additions on the property. | Land | Improvement |
|---|---|---|---|---|
| 2024 | $2,997 | $313,200 | $56,300 | $256,900 |
| 2023 | $2,817 | $299,000 | $53,600 | $245,400 |
| 2022 | $2,670 | $269,700 | $51,000 | $218,700 |
| 2021 | $2,406 | $242,400 | $51,000 | $191,400 |
| 2020 | $2,352 | $236,900 | $51,000 | $185,900 |
| 2019 | $2,242 | $225,900 | $48,300 | $177,600 |
| 2018 | $2,257 | $221,500 | $48,300 | $173,200 |
| 2017 | $2,222 | $209,800 | $46,400 | $163,400 |
| 2016 | $2,170 | $204,000 | $46,400 | $157,600 |
| 2014 | $2,151 | $199,000 | $44,700 | $154,300 |
Source: Public Records
Map
Nearby Homes
- 1836 Crystal Bay East Dr
- 1847 Crystal Bay Dr E
- 5906 Juna Ave
- 5926 Juna Ave
- 5914 Juna Ave
- 5962 Oak Hill Dr W
- 5879 Farwell Ave
- 4145 Los Gatos Ave
- 7624 Quail Ridge N
- 7676 Amber Turn
- 6123 Haworth Cir
- 1117 Valley View Dr
- 6890 Ben Riley Ct
- 0 S County Road 725 E
- 6588 Dunsdin Dr
- ALWICK Plan at Trescott - Gardens
- PARKETTE Plan at Trescott - Gardens
- ALDEN Plan at Trescott - Gardens
- SHELBURN Plan at Trescott - Gardens
- MAJESTIC Plan at Trescott - Overlook
- 1004 Cedar Glen Dr S
- 1012 Cedar Glen South Dr
- 1001 Cedar Glen North Dr
- 1003 Cedar Glen South Dr
- 1009 Cedar Glen North Dr
- 1920 Crystal Bay East Dr
- 1020 Cedar Glen South Dr
- 1916 Crystal Bay Dr E
- 1916 Crystal Bay East Dr
- 1908 Crystal Bay Dr E
- 1908 Crystal Bay East Dr
- 1912 Crystal Bay East Dr
- 1920 Crystal Bay Dr E
- 1011 Cedar Glen South Dr
- 1912 Crystal Bay Dr E
- 1017 Cedar Glen North Dr
- 1856 Crystal Bay East Dr
- 1017 Cedar Glen Dr N
- 1856 Crystal Bay Dr E
- 1019 Cedar Glen Dr S