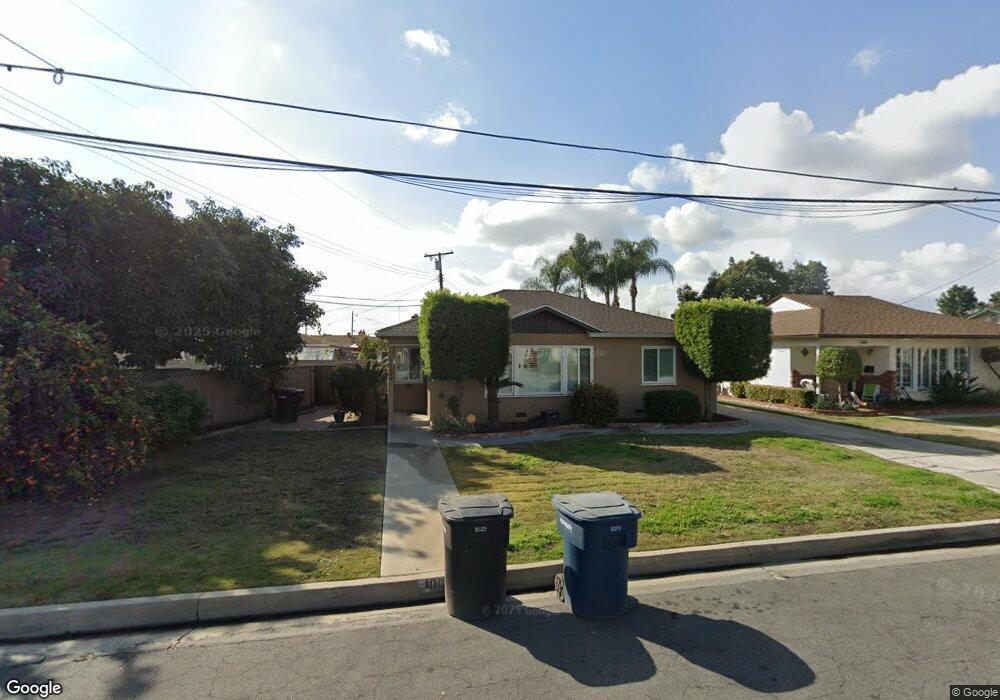
10040 Lindale St Bellflower, CA 90706
Estimated Value: $757,000 - $841,000
2
Beds
2
Baths
1,412
Sq Ft
$571/Sq Ft
Est. Value
About This Home
This home is located at 10040 Lindale St, Bellflower, CA 90706 and is currently estimated at $806,489, approximately $571 per square foot. 10040 Lindale St is a home located in Los Angeles County with nearby schools including Frank E. Woodruff Elementary School, Bellflower High School, and St. Dominic Savio School.
Ownership History
Date
Name
Owned For
Owner Type
Purchase Details
Closed on
Jun 4, 1999
Sold by
Unger Kara
Bought by
Unger Erik
Current Estimated Value
Home Financials for this Owner
Home Financials are based on the most recent Mortgage that was taken out on this home.
Original Mortgage
$163,395
Outstanding Balance
$43,768
Interest Rate
7.24%
Mortgage Type
FHA
Estimated Equity
$762,721
Purchase Details
Closed on
Jun 3, 1999
Sold by
Unger Erik
Bought by
Hurst Jerone
Home Financials for this Owner
Home Financials are based on the most recent Mortgage that was taken out on this home.
Original Mortgage
$163,395
Outstanding Balance
$43,768
Interest Rate
7.24%
Mortgage Type
FHA
Estimated Equity
$762,721
Purchase Details
Closed on
Sep 20, 1996
Sold by
Trust Watkins James C Tr James C Watkins
Bought by
Unger James Paul
Home Financials for this Owner
Home Financials are based on the most recent Mortgage that was taken out on this home.
Original Mortgage
$108,000
Interest Rate
8.14%
Create a Home Valuation Report for This Property
The Home Valuation Report is an in-depth analysis detailing your home's value as well as a comparison with similar homes in the area
Home Values in the Area
Average Home Value in this Area
Purchase History
| Date | Buyer | Sale Price | Title Company |
|---|---|---|---|
| Unger Erik | -- | South Coast Title | |
| Hurst Jerone | $164,500 | South Coast Title | |
| Unger James Paul | $135,000 | -- |
Source: Public Records
Mortgage History
| Date | Status | Borrower | Loan Amount |
|---|---|---|---|
| Open | Hurst Jerone | $163,395 | |
| Previous Owner | Unger James Paul | $108,000 |
Source: Public Records
Tax History
| Year | Tax Paid | Tax Assessment Tax Assessment Total Assessment is a certain percentage of the fair market value that is determined by local assessors to be the total taxable value of land and additions on the property. | Land | Improvement |
|---|---|---|---|---|
| 2025 | $3,365 | $252,808 | $162,446 | $90,362 |
| 2024 | $3,365 | $247,852 | $159,261 | $88,591 |
| 2023 | $3,240 | $242,993 | $156,139 | $86,854 |
| 2022 | $3,181 | $238,229 | $153,078 | $85,151 |
| 2021 | $3,113 | $233,559 | $150,077 | $83,482 |
| 2019 | $3,035 | $226,633 | $145,627 | $81,006 |
| 2018 | $2,878 | $222,190 | $142,772 | $79,418 |
| 2016 | $2,753 | $213,564 | $137,229 | $76,335 |
| 2015 | $2,697 | $210,357 | $135,168 | $75,189 |
| 2014 | $2,665 | $206,238 | $132,521 | $73,717 |
Source: Public Records
Map
Nearby Homes
- 9872 Potter St
- 9917 Van Ruiten St
- 14008 Cornuta Ave
- 10349 Mapledale St
- 13933 Carpintero Ave
- 15355 Eucalyptus Ave
- 13912 Mcnab Ave
- 10456 Mapledale St
- 14564 Charlemagne Ave
- 10462 Somerset Blvd
- 15539 Woodruff Ave Unit 17
- 15539 Woodruff Ave Unit 9
- 15551 Cornuta Ave
- 9825 Hoback St
- 10525 Somerset Blvd Unit 40
- 10525 Somerset Blvd Unit 12
- 9615 Tolly St
- 13741 Carfax Ave
- 10246 Muroc St
- 10428 Hopland St
- 10030 Lindale St
- 14511 Cornuta Ave
- 14517 Cornuta Ave
- 14507 Cornuta Ave
- 10026 Lindale St
- 14521 Cornuta Ave
- 14504 Eastbrook Ave
- 14501 Cornuta Ave
- 14500 Eastbrook Ave
- 14527 Cornuta Ave
- 10022 Lindale St
- 10039 Lindale St
- 10035 Lindale St
- 10045 Lindale St
- 10027 Lindale St
- 14539 Cornuta Ave
- 10016 Lindale St
- 10021 Lindale St
- 14409 Cornuta Ave
- 14508 Eastbrook Ave
Your Personal Tour Guide
Ask me questions while you tour the home.