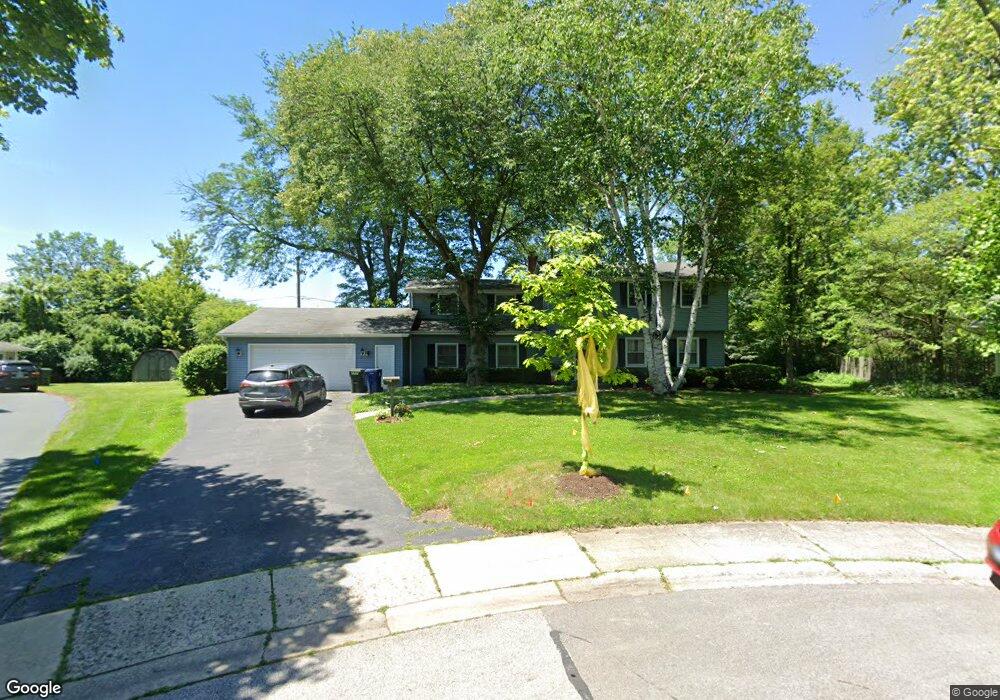
1005 Catalpa Ln Naperville, IL 60540
West Highlands NeighborhoodEstimated Value: $564,446 - $620,000
--
Bed
1
Bath
2,418
Sq Ft
$248/Sq Ft
Est. Value
About This Home
This home is located at 1005 Catalpa Ln, Naperville, IL 60540 and is currently estimated at $600,112, approximately $248 per square foot. 1005 Catalpa Ln is a home located in DuPage County with nearby schools including Elmwood Elementary School, Lincoln Jr. High School, and Naperville Central High School.
Ownership History
Date
Name
Owned For
Owner Type
Purchase Details
Closed on
Feb 11, 2010
Sold by
Stelle Joan S
Bought by
Stelle Joan S and The Stelle Family 2006 Declaration Of Tr
Current Estimated Value
Purchase Details
Closed on
Jun 25, 2009
Sold by
Stelle Robert W and Stelle Joan S
Bought by
Stelle Robert W and Stelle Joan S
Home Financials for this Owner
Home Financials are based on the most recent Mortgage that was taken out on this home.
Original Mortgage
$220,000
Interest Rate
5.49%
Mortgage Type
Stand Alone Refi Refinance Of Original Loan
Purchase Details
Closed on
Mar 8, 2006
Sold by
Stelle Robert W and Stelle Joan S
Bought by
Stelle Robert W and Stelle Joan S
Create a Home Valuation Report for This Property
The Home Valuation Report is an in-depth analysis detailing your home's value as well as a comparison with similar homes in the area
Home Values in the Area
Average Home Value in this Area
Purchase History
| Date | Buyer | Sale Price | Title Company |
|---|---|---|---|
| Stelle Joan S | -- | None Available | |
| Stelle Robert W | -- | First American Title | |
| Stelle Robert W | -- | None Available |
Source: Public Records
Mortgage History
| Date | Status | Borrower | Loan Amount |
|---|---|---|---|
| Closed | Stelle Robert W | $220,000 |
Source: Public Records
Tax History Compared to Growth
Tax History
| Year | Tax Paid | Tax Assessment Tax Assessment Total Assessment is a certain percentage of the fair market value that is determined by local assessors to be the total taxable value of land and additions on the property. | Land | Improvement |
|---|---|---|---|---|
| 2024 | $9,539 | $171,707 | $77,806 | $93,901 |
| 2023 | $9,143 | $156,710 | $71,010 | $85,700 |
| 2022 | $8,593 | $143,770 | $65,150 | $78,620 |
| 2021 | $8,266 | $138,340 | $62,690 | $75,650 |
| 2020 | $8,083 | $135,850 | $61,560 | $74,290 |
| 2019 | $7,831 | $129,980 | $58,900 | $71,080 |
| 2018 | $7,387 | $123,200 | $55,830 | $67,370 |
| 2017 | $7,226 | $119,050 | $53,950 | $65,100 |
| 2016 | $7,067 | $114,750 | $52,000 | $62,750 |
| 2015 | $6,997 | $108,060 | $48,970 | $59,090 |
| 2014 | $7,214 | $102,920 | $46,640 | $56,280 |
| 2013 | $7,105 | $103,160 | $46,750 | $56,410 |
Source: Public Records
Map
Nearby Homes
- 132 Robin Hill Dr
- 225 Elmwood Dr
- 845 Tulip Ln
- 165 Tamarack Ave
- 316 Hemlock Ln
- 821 Wellner Rd
- 706 S Loomis St Unit D
- 1033 Emerald Dr
- 616 Driftwood Ct
- 908 Julian Ct
- 344 Waxwing Ave
- 1443 Meander Dr
- 520 S Washington St Unit 103
- 520 S Washington St Unit 201
- 923 Tim Tam Cir
- 488 S Columbia St
- 820 Prairie Ave
- 1259 Natchez Trace Cir
- 440 S Columbia St
- 328 S Loomis St
- 1004 Catalpa Ln
- 1009 Catalpa Ln
- 913 Hickory Ln
- 1013 Catalpa Ln Unit 11
- 1008 Catalpa Ln
- 909 Hickory Ln
- 221 Sycamore Dr
- 1017 Catalpa Ln Unit 11
- 915 Hickory Ln
- 225 Sycamore Dr
- 1012 Catalpa Ln
- 217 Sycamore Dr Unit 11
- 50 Elmwood Dr
- 54 Elmwood Dr
- 213 Sycamore Dr
- 905 Hickory Ln
- 918 Hickory Ln
- 1021 Catalpa Ln
- 1016 Catalpa Ln
- 44 Elmwood Dr