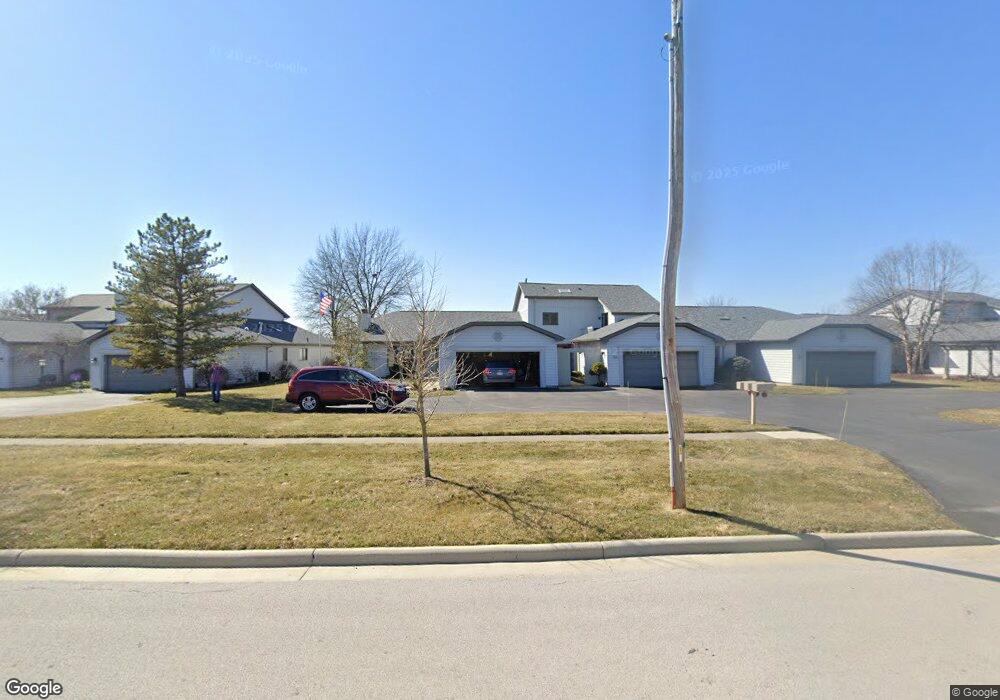
1005 Fox Run Rd Unit U6 Findlay, OH 45840
Estimated Value: $232,000 - $308,000
2
Beds
2
Baths
1,780
Sq Ft
$151/Sq Ft
Est. Value
About This Home
This home is located at 1005 Fox Run Rd Unit U6, Findlay, OH 45840 and is currently estimated at $268,268, approximately $150 per square foot. 1005 Fox Run Rd Unit U6 is a home located in Hancock County with nearby schools including Wilson Vance Elementary School, Whittier Elementary School, and Glenwood Middle School.
Ownership History
Date
Name
Owned For
Owner Type
Purchase Details
Closed on
Jul 24, 2012
Sold by
Asbury Douglas M and Asbury Becky M
Bought by
Mckinniss Paul D and Mckinniss Shirley A
Current Estimated Value
Home Financials for this Owner
Home Financials are based on the most recent Mortgage that was taken out on this home.
Original Mortgage
$155,000
Outstanding Balance
$106,147
Interest Rate
3.73%
Mortgage Type
Seller Take Back
Estimated Equity
$162,122
Purchase Details
Closed on
Dec 3, 2001
Sold by
Fifth Third Bank
Bought by
Asbury Douglas M and Asbury Becky M
Purchase Details
Closed on
Apr 7, 1993
Bought by
Fifth Third Bank Nw Oh Tr
Purchase Details
Closed on
Apr 13, 1992
Bought by
Kuhlman Yvonne W
Purchase Details
Closed on
Dec 8, 1983
Bought by
Kuhlman Wilson G and Kuhlman Yvonne
Purchase Details
Closed on
Jun 21, 1983
Bought by
Kuhlman Wilson G and Kuhlman Yvonne
Create a Home Valuation Report for This Property
The Home Valuation Report is an in-depth analysis detailing your home's value as well as a comparison with similar homes in the area
Home Values in the Area
Average Home Value in this Area
Purchase History
| Date | Buyer | Sale Price | Title Company |
|---|---|---|---|
| Mckinniss Paul D | $180,000 | Whitnam Title | |
| Asbury Douglas M | $150,000 | -- | |
| Fifth Third Bank Nw Oh Tr | -- | -- | |
| Kuhlman Yvonne W | -- | -- | |
| Kuhlman Wilson G | -- | -- | |
| Kuhlman Wilson G | $89,900 | -- |
Source: Public Records
Mortgage History
| Date | Status | Borrower | Loan Amount |
|---|---|---|---|
| Open | Mckinniss Paul D | $155,000 |
Source: Public Records
Tax History
| Year | Tax Paid | Tax Assessment Tax Assessment Total Assessment is a certain percentage of the fair market value that is determined by local assessors to be the total taxable value of land and additions on the property. | Land | Improvement |
|---|---|---|---|---|
| 2024 | $2,072 | $68,140 | $3,680 | $64,460 |
| 2023 | $2,098 | $68,140 | $3,680 | $64,460 |
| 2022 | $2,106 | $68,140 | $3,680 | $64,460 |
| 2021 | $2,000 | $57,890 | $2,800 | $55,090 |
| 2020 | $2,000 | $57,890 | $2,800 | $55,090 |
| 2019 | $1,961 | $57,890 | $2,800 | $55,090 |
| 2018 | $1,788 | $49,880 | $2,800 | $47,080 |
| 2017 | $894 | $49,880 | $2,800 | $47,080 |
| 2016 | $1,724 | $48,880 | $2,800 | $46,080 |
| 2015 | $1,717 | $48,020 | $2,800 | $45,220 |
| 2014 | $1,717 | $48,020 | $2,800 | $45,220 |
| 2012 | $1,858 | $50,900 | $2,800 | $48,100 |
Source: Public Records
Map
Nearby Homes
- 845 Fox Run Rd
- 821 Fox Run Rd Unit 6
- 801 Fox Run Rd
- 2245 Fox Run Cir Unit 1037
- 1121 Fox Run Rd
- 701 Red Fox Rd
- 827 Abbey Ln
- 456 Strathaven Dr
- 2000 Rush Creek Ct
- 1926 Queenswood Dr
- 1825 Greendale Ave
- 1203 Chateau Ct
- 8131 Brookfield Cir
- 15329 E Us Route 224
- 1828 Queenswood Dr
- 8457 Lakewood Dr
- 0 E Us Route 224
- 2143 Bluestone Dr
- 1724 Queenswood Dr Unit 10 (2-C)
- 631 Winterhaven Dr
- 1003 Fox Run Rd
- 1001 Fox Run Rd Unit 4
- 927 Fox Run Rd
- 1011 Fox Run Rd
- 1013 Fox Run Rd
- 929 Fox Run Rd Unit U3
- 925 Fox Run Rd Unit 1
- 1015 Fox Run Rd
- 1023 Fox Run Road (P)
- 2300 Foxbury Ln
- 1023 Fox Run Rd Unit 2
- 1025 Fox Run Rd
- 1021 Fox Run Rd
- 2301 Foxfire Ln
- 917 Fox Run Rd
- 1012 Fox Run Rd Unit U2
- 915 Fox Run Rd Unit 14
- 2301 Foxbury Ln
- 2303 Foxbury Ln Unit U2
- 1010 Fox Run Rd Unit 1
Your Personal Tour Guide
Ask me questions while you tour the home.