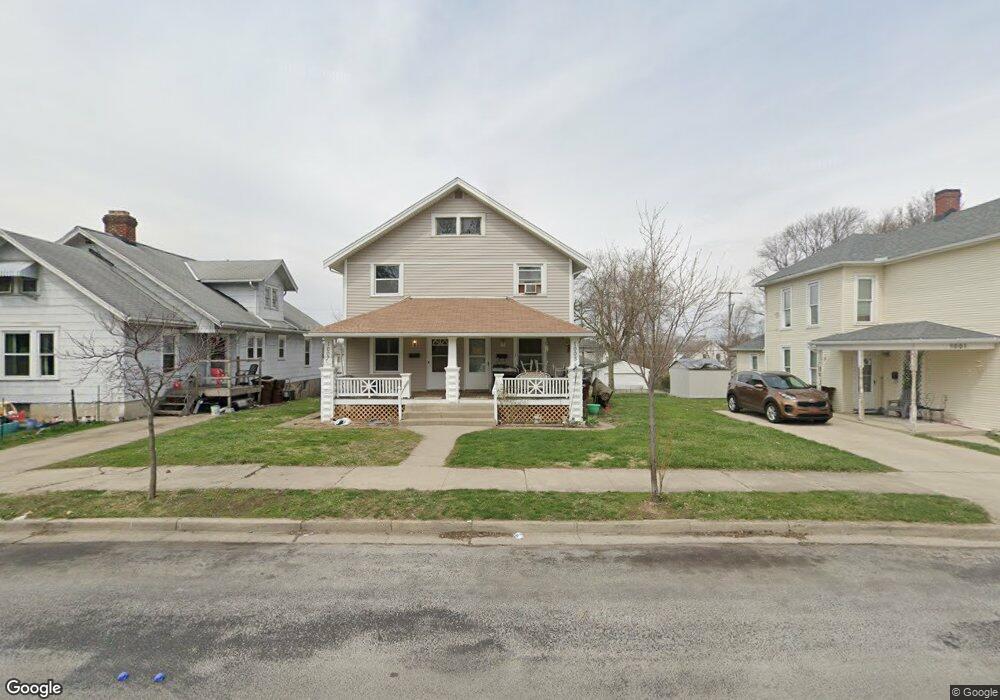
1005 Pine St Unit 1007 Springfield, OH 45505
Estimated Value: $87,000 - $121,478
6
Beds
2
Baths
2,240
Sq Ft
$47/Sq Ft
Est. Value
About This Home
This home is located at 1005 Pine St Unit 1007, Springfield, OH 45505 and is currently estimated at $105,120, approximately $46 per square foot. 1005 Pine St Unit 1007 is a home located in Clark County with nearby schools including Kenwood Elementary School, Hayward Middle School, and Springfield High School.
Ownership History
Date
Name
Owned For
Owner Type
Purchase Details
Closed on
May 17, 2023
Sold by
Brown Arthur Lee and Brown Staci Lynn
Bought by
Wildcat Rentals Llc
Current Estimated Value
Home Financials for this Owner
Home Financials are based on the most recent Mortgage that was taken out on this home.
Original Mortgage
$45,500
Outstanding Balance
$39,904
Interest Rate
5.54%
Mortgage Type
New Conventional
Estimated Equity
$65,216
Purchase Details
Closed on
May 30, 2007
Sold by
Hud
Bought by
Brown Arthur Lee and Brown Staci Lynn
Purchase Details
Closed on
Jul 16, 2006
Sold by
Union Planters Bank Na
Bought by
Hud
Purchase Details
Closed on
Mar 31, 2006
Sold by
Lanum Phyllis and Lanum Phyllis J
Bought by
Union Planters Bank Na and Regions Mortgage Inc
Purchase Details
Closed on
May 28, 1997
Sold by
Buffenbarger Douglas M
Bought by
Investec Enterprises
Home Financials for this Owner
Home Financials are based on the most recent Mortgage that was taken out on this home.
Original Mortgage
$74,921
Interest Rate
8.27%
Mortgage Type
New Conventional
Create a Home Valuation Report for This Property
The Home Valuation Report is an in-depth analysis detailing your home's value as well as a comparison with similar homes in the area
Home Values in the Area
Average Home Value in this Area
Purchase History
| Date | Buyer | Sale Price | Title Company |
|---|---|---|---|
| Wildcat Rentals Llc | $55,000 | Ohio Real Estate Title | |
| Wildcat Rentals Llc | $55,000 | Ohio Real Estate Title | |
| Brown Arthur Lee | $41,664 | Lakeside Title & Escrow | |
| Hud | -- | Areawide Title | |
| Union Planters Bank Na | $81,083 | Areawide Title | |
| Investec Enterprises | $60,000 | -- |
Source: Public Records
Mortgage History
| Date | Status | Borrower | Loan Amount |
|---|---|---|---|
| Open | Wildcat Rentals Llc | $45,500 | |
| Closed | Wildcat Rentals Llc | $45,500 | |
| Previous Owner | Investec Enterprises | $74,921 |
Source: Public Records
Tax History
| Year | Tax Paid | Tax Assessment Tax Assessment Total Assessment is a certain percentage of the fair market value that is determined by local assessors to be the total taxable value of land and additions on the property. | Land | Improvement |
|---|---|---|---|---|
| 2025 | $1,392 | $41,650 | $2,990 | $38,660 |
| 2024 | $1,323 | $27,460 | $2,350 | $25,110 |
| 2023 | $1,323 | $27,460 | $2,350 | $25,110 |
| 2022 | $1,356 | $27,460 | $2,350 | $25,110 |
| 2021 | $1,335 | $24,970 | $2,140 | $22,830 |
| 2020 | $1,338 | $24,970 | $2,140 | $22,830 |
| 2019 | $1,342 | $24,970 | $2,140 | $22,830 |
| 2018 | $1,242 | $22,200 | $1,780 | $20,420 |
| 2017 | $1,241 | $22,194 | $1,778 | $20,416 |
| 2016 | $1,242 | $22,194 | $1,778 | $20,416 |
| 2015 | $1,267 | $22,194 | $1,778 | $20,416 |
| 2014 | $1,261 | $22,194 | $1,778 | $20,416 |
| 2013 | $624 | $22,194 | $1,778 | $20,416 |
Source: Public Records
Map
Nearby Homes
- 908 Pine St
- 1111 Lafayette Ave
- 1417 Kenton St
- 1005 Burt St
- 453 E Pleasant St
- 652 E Southern Ave
- 900 E Rose St
- 718 Summer St
- 1008 Tibbetts Ave
- 1440 Selma Rd
- 705 York St
- 1652 Kenton St
- 1225 Beacon St
- 1065 Mound St Unit 1067
- 360 S Greenmount Ave
- 625 Tibbetts Ave
- 1609 Irwin Ave
- 1714 Kenton St
- 550 E Rose St
- 441 E Euclid Ave
Your Personal Tour Guide
Ask me questions while you tour the home.