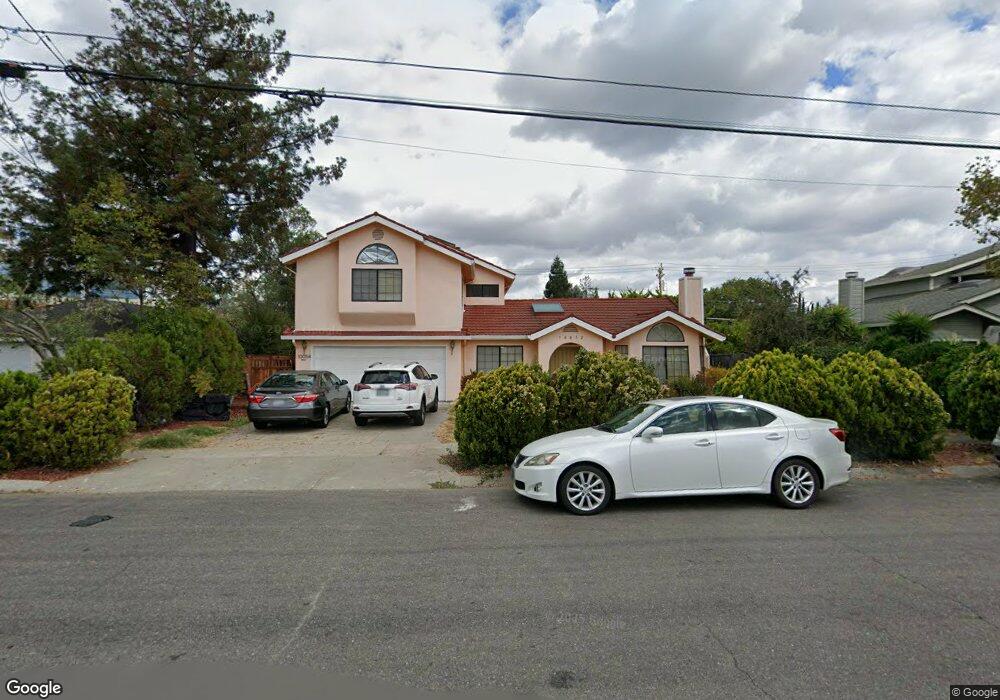
10052 Bret Ave Cupertino, CA 95014
Downtown Cupertino NeighborhoodEstimated Value: $3,506,033 - $4,413,000
5
Beds
4
Baths
2,546
Sq Ft
$1,578/Sq Ft
Est. Value
About This Home
This home is located at 10052 Bret Ave, Cupertino, CA 95014 and is currently estimated at $4,017,508, approximately $1,577 per square foot. 10052 Bret Ave is a home located in Santa Clara County with nearby schools including D. J. Sedgwick Elementary School, Warren E. Hyde Middle School, and Cupertino High School.
Ownership History
Date
Name
Owned For
Owner Type
Purchase Details
Closed on
Jan 12, 2023
Sold by
Lee Jen-Te
Bought by
Kuo Hui-Yi
Current Estimated Value
Purchase Details
Closed on
Aug 13, 2008
Sold by
Chu Der Wei and Ma Shu Chun
Bought by
Lee Jen Te and Kuo Hui Yi
Home Financials for this Owner
Home Financials are based on the most recent Mortgage that was taken out on this home.
Original Mortgage
$123,000
Interest Rate
6.5%
Mortgage Type
Credit Line Revolving
Create a Home Valuation Report for This Property
The Home Valuation Report is an in-depth analysis detailing your home's value as well as a comparison with similar homes in the area
Home Values in the Area
Average Home Value in this Area
Purchase History
| Date | Buyer | Sale Price | Title Company |
|---|---|---|---|
| Kuo Hui-Yi | -- | -- | |
| Lee Jen Te | $1,140,000 | Chicago Title Co |
Source: Public Records
Mortgage History
| Date | Status | Borrower | Loan Amount |
|---|---|---|---|
| Previous Owner | Lee Jen Te | $123,000 | |
| Previous Owner | Lee Jen Te | $417,000 |
Source: Public Records
Tax History Compared to Growth
Tax History
| Year | Tax Paid | Tax Assessment Tax Assessment Total Assessment is a certain percentage of the fair market value that is determined by local assessors to be the total taxable value of land and additions on the property. | Land | Improvement |
|---|---|---|---|---|
| 2025 | $20,666 | $1,726,095 | $1,174,433 | $551,662 |
| 2024 | $20,666 | $1,692,251 | $1,151,405 | $540,846 |
| 2023 | $19,159 | $1,555,241 | $1,128,829 | $426,412 |
| 2022 | $17,311 | $1,383,365 | $1,106,696 | $276,669 |
| 2021 | $17,133 | $1,356,242 | $1,084,997 | $271,245 |
| 2020 | $16,922 | $1,342,336 | $1,073,872 | $268,464 |
| 2019 | $16,538 | $1,316,016 | $1,052,816 | $263,200 |
| 2018 | $16,102 | $1,290,213 | $1,032,173 | $258,040 |
| 2017 | $16,014 | $1,264,916 | $1,011,935 | $252,981 |
| 2016 | $15,490 | $1,240,115 | $992,094 | $248,021 |
| 2015 | $15,366 | $1,221,488 | $977,192 | $244,296 |
| 2014 | $14,950 | $1,197,562 | $958,051 | $239,511 |
Source: Public Records
Map
Nearby Homes
- 10161 Stern Ave
- 10163 Bret Ave
- 10337 Menhart Ln
- 18630 Crabtree Ave
- 19251 Phil Ln
- 18901 Tuggle Ave
- 18817 Tuggle Ave
- 10357 Greenwood Ct
- 10101 Richwood Dr
- 915 S Tantau Ave
- 5011 Lapa Dr
- 18980 Newsom Ave
- 10860 Johnson Ave
- 810 Raintree Dr
- 5688 Kimberly St
- 1002 Oaktree Dr
- 19972 Portal Plaza
- 19980 Portal Plaza
- 4733 Lago Vista Cir
- 1018 Huntingdon Dr
- 10038 Bret Ave
- 10066 Bret Ave
- 10057 Stern Ave
- 10069 Stern Ave
- 10024 Bret Ave
- 10080 Bret Ave
- 10081 Stern Ave
- 10053 Bret Ave
- 10065 Bret Ave
- 10037 Bret Ave
- 10093 Stern Ave
- 10010 Bret Ave
- 10094 Bret Ave
- 10081 Bret Ave
- 19028 Stevens Creek Blvd Unit C
- 19028 Stevens Creek Blvd Unit 2
- 19028 Stevens Creek Blvd
- 19028 Stevens Creek Blvd Unit 3
- 10105 Stern Ave
- 10095 Bret Ave