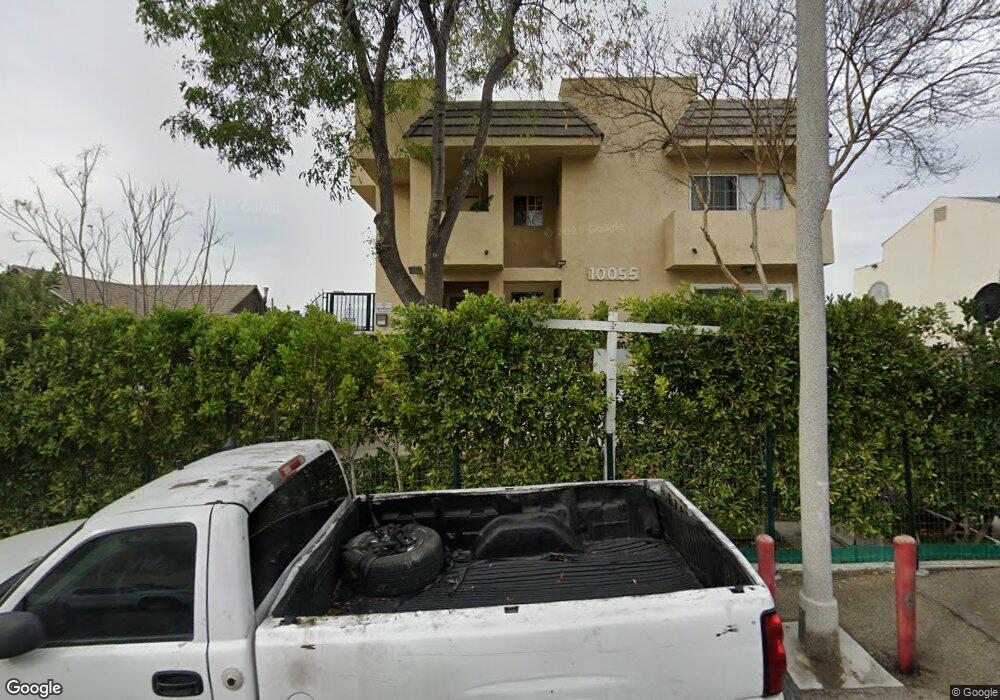
10055 Samoa Ave Unit 204 Tujunga, CA 91042
Estimated Value: $497,000 - $539,000
2
Beds
2
Baths
880
Sq Ft
$588/Sq Ft
Est. Value
About This Home
This home is located at 10055 Samoa Ave Unit 204, Tujunga, CA 91042 and is currently estimated at $517,412, approximately $587 per square foot. 10055 Samoa Ave Unit 204 is a home located in Los Angeles County with nearby schools including Pinewood Avenue Elementary School, Mt. Gleason Middle School, and Verdugo Hills Senior High School.
Ownership History
Date
Name
Owned For
Owner Type
Purchase Details
Closed on
May 24, 2024
Sold by
Dizaj Giverg Najarian
Bought by
Giverg Najarian Dizaj And Armineh Havan Revoc and Dizaj
Current Estimated Value
Purchase Details
Closed on
Mar 18, 2010
Sold by
Federal Home Loan Mortgage Corporation
Bought by
Dizaj Giverg Najarian
Home Financials for this Owner
Home Financials are based on the most recent Mortgage that was taken out on this home.
Original Mortgage
$131,250
Interest Rate
4.88%
Mortgage Type
New Conventional
Purchase Details
Closed on
Mar 21, 2007
Sold by
V A E Group Llc
Bought by
Stepanyan Gevorg
Home Financials for this Owner
Home Financials are based on the most recent Mortgage that was taken out on this home.
Original Mortgage
$263,200
Interest Rate
7.75%
Mortgage Type
Purchase Money Mortgage
Create a Home Valuation Report for This Property
The Home Valuation Report is an in-depth analysis detailing your home's value as well as a comparison with similar homes in the area
Home Values in the Area
Average Home Value in this Area
Purchase History
| Date | Buyer | Sale Price | Title Company |
|---|---|---|---|
| Giverg Najarian Dizaj And Armineh Havan Revoc | -- | None Listed On Document | |
| Giverg Najarian Dizaj And Armineh Havan Revoc | -- | None Listed On Document | |
| Dizaj Giverg Najarian | $175,000 | Lsi Title Agency | |
| Dizaj Giverg Najarian | -- | Lsi Title Agency | |
| Stepanyan Gevorg | $329,000 | Chicago Title Subdivision |
Source: Public Records
Mortgage History
| Date | Status | Borrower | Loan Amount |
|---|---|---|---|
| Previous Owner | Dizaj Giverg Najarian | $131,250 | |
| Previous Owner | Stepanyan Gevorg | $263,200 |
Source: Public Records
Tax History
| Year | Tax Paid | Tax Assessment Tax Assessment Total Assessment is a certain percentage of the fair market value that is determined by local assessors to be the total taxable value of land and additions on the property. | Land | Improvement |
|---|---|---|---|---|
| 2025 | $2,812 | $225,876 | $80,409 | $145,467 |
| 2024 | $2,812 | $221,448 | $78,833 | $142,615 |
| 2023 | $2,759 | $217,107 | $77,288 | $139,819 |
| 2022 | $2,628 | $212,851 | $75,773 | $137,078 |
| 2021 | $2,592 | $208,679 | $74,288 | $134,391 |
| 2020 | $2,615 | $206,540 | $73,527 | $133,013 |
| 2019 | $2,513 | $202,491 | $72,086 | $130,405 |
| 2018 | $2,496 | $198,522 | $70,673 | $127,849 |
| 2016 | $2,378 | $190,816 | $67,930 | $122,886 |
| 2015 | $2,344 | $187,951 | $66,910 | $121,041 |
| 2014 | $2,357 | $184,270 | $65,600 | $118,670 |
Source: Public Records
Map
Nearby Homes
- 0 Tujunga Unit SR26033907
- 10129 Commerce Ave
- 9938 Commerce Ave
- 7123 Greeley St Unit 102
- 10139 Hillhaven Ave
- 0 Commerce Ave
- 10214 Samoa Ave Unit 25
- 10219 Pinewood Ave Unit 2
- 7049 Sunnycrest Trail
- 10136 Silverton Ave
- 0 Foothill Blvd
- 7006 Valmont St Unit B
- 10274 Tujunga Canyon Blvd Unit 4
- 7025 Day St
- 7115 Shadygrove St
- 9817 Commerce Ave
- 7225 Apperson St Unit 105
- 9810 Hillhaven Ave
- 9631 Oak Bend Dr
- 9727 N Estaban Way
- 10055 Samoa Ave Unit 203
- 10055 Samoa Ave Unit 202
- 10055 Samoa Ave Unit 105
- 10055 Samoa Ave Unit 103
- 10055 Samoa Ave Unit 201
- 10055 Samoa Ave Unit 101
- 10055 Samoa Ave Unit 106
- 10055 Samoa Ave Unit 205
- 10055 Samoa Ave Unit 102
- 10055 Samoa Ave Unit 104
- 10041 Samoa Ave
- 10053 Samoa Ave Unit 104
- 10053 Samoa Ave Unit 105
- 10053 Samoa Ave Unit 102
- 10053 Samoa Ave Unit 202
- 10037 Samoa Ave
- 10037 Samoa Ave Unit 16
- 10037 Samoa Ave Unit 15
- 10037 Samoa Ave Unit 17
- 10037 Samoa Ave Unit 11
Your Personal Tour Guide
Ask me questions while you tour the home.