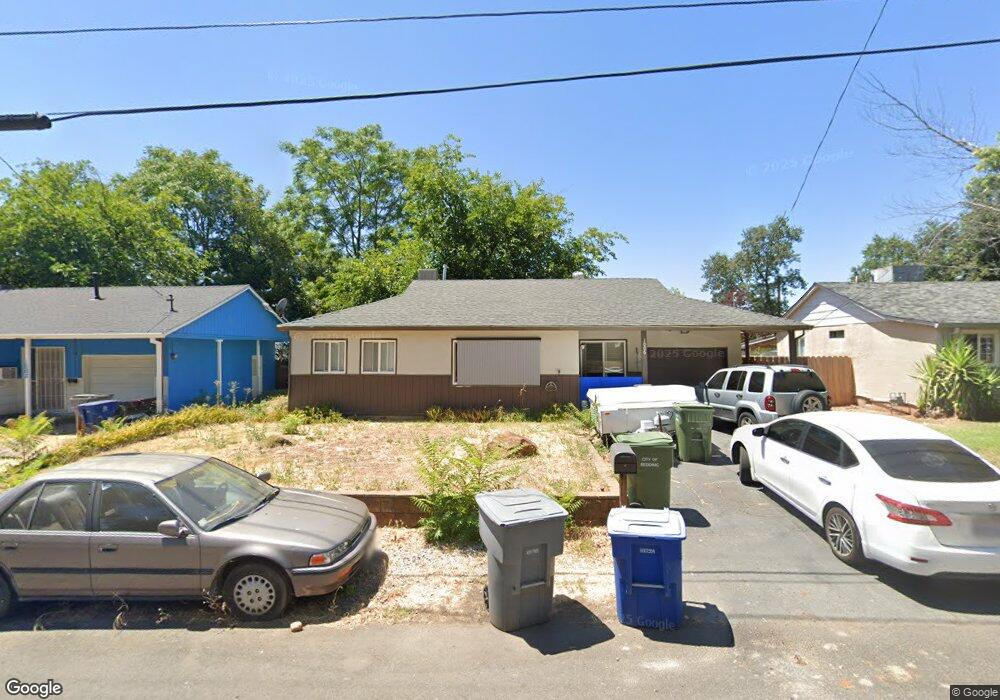
1006 A St Redding, CA 96002
South Bechelli NeighborhoodEstimated Value: $219,456 - $251,000
3
Beds
1
Bath
1,000
Sq Ft
$234/Sq Ft
Est. Value
About This Home
This home is located at 1006 A St, Redding, CA 96002 and is currently estimated at $233,864, approximately $233 per square foot. 1006 A St is a home located in Shasta County with nearby schools including Rother Elementary School, Parsons Junior High School, and Enterprise High School.
Ownership History
Date
Name
Owned For
Owner Type
Purchase Details
Closed on
May 26, 2004
Sold by
Killion John W
Bought by
Killion John W
Current Estimated Value
Purchase Details
Closed on
Sep 25, 2001
Sold by
Federal National Mortgage Association
Bought by
Killion John W
Home Financials for this Owner
Home Financials are based on the most recent Mortgage that was taken out on this home.
Original Mortgage
$58,000
Outstanding Balance
$22,736
Interest Rate
6.91%
Mortgage Type
Purchase Money Mortgage
Estimated Equity
$211,128
Purchase Details
Closed on
Sep 7, 2001
Sold by
Menchaca Andrew J and Menchaca Beatrice M
Bought by
Federal National Mortgage Association
Home Financials for this Owner
Home Financials are based on the most recent Mortgage that was taken out on this home.
Original Mortgage
$58,000
Outstanding Balance
$22,736
Interest Rate
6.91%
Mortgage Type
Purchase Money Mortgage
Estimated Equity
$211,128
Create a Home Valuation Report for This Property
The Home Valuation Report is an in-depth analysis detailing your home's value as well as a comparison with similar homes in the area
Home Values in the Area
Average Home Value in this Area
Purchase History
| Date | Buyer | Sale Price | Title Company |
|---|---|---|---|
| Killion John W | -- | -- | |
| Killion John W | $72,500 | Fidelity National Title Co | |
| Federal National Mortgage Association | $57,478 | -- |
Source: Public Records
Mortgage History
| Date | Status | Borrower | Loan Amount |
|---|---|---|---|
| Open | Killion John W | $58,000 |
Source: Public Records
Tax History
| Year | Tax Paid | Tax Assessment Tax Assessment Total Assessment is a certain percentage of the fair market value that is determined by local assessors to be the total taxable value of land and additions on the property. | Land | Improvement |
|---|---|---|---|---|
| 2025 | $1,190 | $107,078 | $32,488 | $74,590 |
| 2024 | $1,172 | $104,979 | $31,851 | $73,128 |
| 2023 | $1,172 | $102,922 | $31,227 | $71,695 |
| 2022 | $1,139 | $100,905 | $30,615 | $70,290 |
| 2021 | $1,101 | $98,927 | $30,015 | $68,912 |
| 2020 | $1,095 | $97,914 | $29,708 | $68,206 |
| 2019 | $1,087 | $95,995 | $29,126 | $66,869 |
| 2018 | $1,074 | $94,113 | $28,555 | $65,558 |
| 2017 | $1,092 | $92,269 | $27,996 | $64,273 |
| 2016 | $1,022 | $90,461 | $27,448 | $63,013 |
| 2015 | $1,014 | $89,103 | $27,036 | $62,067 |
| 2014 | $1,007 | $87,359 | $26,507 | $60,852 |
Source: Public Records
Map
Nearby Homes
- 1108 4th St
- 1209 C St
- 3428 Adams Ln
- 3650 Cheryl Dr
- 3527 Adams Ln
- 3087 Northwoods Way
- 737 Estate St
- 688 Julie Way
- 3689 Suzanne Way
- 3708 Traverse St
- 1091 Del Sol Place
- 1075 Le Brun Ln
- 890 Parsons Dr
- 2935 Shotwick Trail
- 918 Parsons Dr
- 3081 Henderson Rd
- 0 Churn Creek Rd Unit 25-496
- 0 Churn Creek Rd Unit 26-609
- 0 Churn Creek Rd Unit 25-5491
- 2861 Shotwick Trail
Your Personal Tour Guide
Ask me questions while you tour the home.