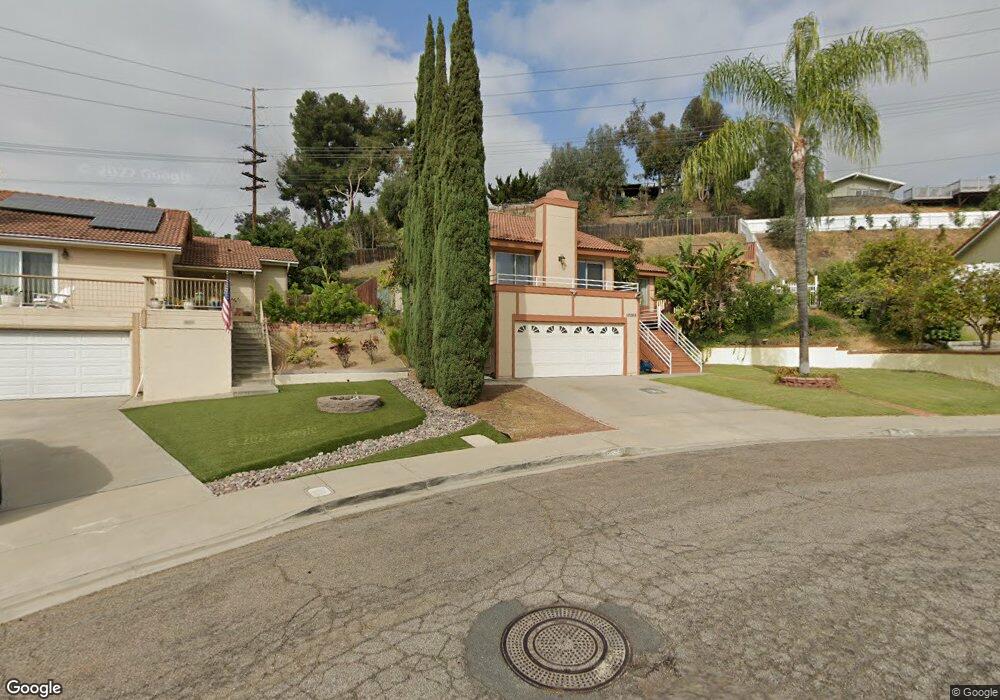
10069 Rothgard Rd Spring Valley, CA 91977
Estimated Value: $822,000 - $885,000
3
Beds
2
Baths
1,639
Sq Ft
$522/Sq Ft
Est. Value
About This Home
This home is located at 10069 Rothgard Rd, Spring Valley, CA 91977 and is currently estimated at $855,329, approximately $521 per square foot. 10069 Rothgard Rd is a home located in San Diego County with nearby schools including Highlands Elementary School, Spring Valley Middle School, and Monte Vista High School.
Ownership History
Date
Name
Owned For
Owner Type
Purchase Details
Closed on
Nov 12, 2020
Sold by
Souza Joseph C
Bought by
Souza Joseph C and Souza Ana M
Current Estimated Value
Home Financials for this Owner
Home Financials are based on the most recent Mortgage that was taken out on this home.
Original Mortgage
$366,450
Outstanding Balance
$326,088
Interest Rate
2.8%
Mortgage Type
New Conventional
Estimated Equity
$529,241
Purchase Details
Closed on
Dec 5, 2008
Sold by
Souza Ana M
Bought by
Souza Joseph C
Home Financials for this Owner
Home Financials are based on the most recent Mortgage that was taken out on this home.
Original Mortgage
$268,000
Interest Rate
6.1%
Mortgage Type
Unknown
Purchase Details
Closed on
Feb 23, 2000
Sold by
Porter Anthony W and Porter Aniceta R
Bought by
Deleon Rosauro C and Deleon Araceli C
Home Financials for this Owner
Home Financials are based on the most recent Mortgage that was taken out on this home.
Original Mortgage
$193,405
Interest Rate
8.21%
Purchase Details
Closed on
Jul 21, 1986
Create a Home Valuation Report for This Property
The Home Valuation Report is an in-depth analysis detailing your home's value as well as a comparison with similar homes in the area
Home Values in the Area
Average Home Value in this Area
Purchase History
| Date | Buyer | Sale Price | Title Company |
|---|---|---|---|
| Souza Joseph C | -- | Fidelity Natl Ttl San Diego | |
| Souza Joseph C | -- | First American Title | |
| Souza Joseph C | $335,000 | First American Title | |
| Deleon Rosauro C | $195,000 | Chicago Title Co | |
| -- | $124,000 | -- |
Source: Public Records
Mortgage History
| Date | Status | Borrower | Loan Amount |
|---|---|---|---|
| Open | Souza Joseph C | $366,450 | |
| Closed | Souza Joseph C | $268,000 | |
| Previous Owner | Deleon Rosauro C | $193,405 |
Source: Public Records
Tax History
| Year | Tax Paid | Tax Assessment Tax Assessment Total Assessment is a certain percentage of the fair market value that is determined by local assessors to be the total taxable value of land and additions on the property. | Land | Improvement |
|---|---|---|---|---|
| 2025 | $5,526 | $431,382 | $160,962 | $270,420 |
| 2024 | $5,526 | $422,924 | $157,806 | $265,118 |
| 2023 | $5,352 | $414,632 | $154,712 | $259,920 |
| 2022 | $5,266 | $406,503 | $151,679 | $254,824 |
| 2021 | $5,212 | $398,533 | $148,705 | $249,828 |
| 2020 | $5,006 | $394,448 | $147,181 | $247,267 |
| 2019 | $4,931 | $386,715 | $144,296 | $242,419 |
| 2018 | $4,869 | $379,133 | $141,467 | $237,666 |
| 2017 | $4,761 | $371,700 | $138,694 | $233,006 |
| 2016 | $4,589 | $364,413 | $135,975 | $228,438 |
| 2015 | $4,553 | $358,940 | $133,933 | $225,007 |
| 2014 | $4,469 | $351,910 | $131,310 | $220,600 |
Source: Public Records
Map
Nearby Homes
- 10235 Madrid Way Unit 114
- 3605 S Barcelona St
- 10620 Garden Way
- 2508 Dorm Way
- 0 Campo Rd Unit PTP2600859
- 2820 Highlands Blvd
- 9860 Dale Ave Unit C12
- 9860 Dale Ave Unit D7
- 9860 Dale Ave Unit D10
- 2304 Meadowridge Place
- 3536 Ybarra Rd
- 9881 Aldergrove Ln
- 9869 Aldergrove Ln
- 3557 Kenora Dr Unit 41
- 3557 Kenora Dr Unit 22
- 3557 Kenora Dr Unit 6
- 10142 Sierra Madre Rd
- 10812 Charing Cross Rd
- 3065 Charwood Ct
- 3067 Charwood Ct
- 10079 Rothgard Rd
- 10059 Rothgard Rd
- 3321 Cristobal Way
- 3329 Cristobal Way
- 10049 Rothgard Rd
- 3313 Cristobal Way
- 10119 Rothgard Rd
- 3337 Cristobal Way
- 10056 Rothgard Rd
- 3305 Cristobal Way
- 10039 Rothgard Rd
- 3345 Cristobal Way
- 10046 Rothgard Rd
- 3263 Cristobal Way
- 10109 Rothgard Rd
- 10036 Rothgard Rd
- 10065 Casa Nueva St
- 3353 CRIST Way
- 3353 Cristobal Way
- 10029 Rothgard Rd
Your Personal Tour Guide
Ask me questions while you tour the home.