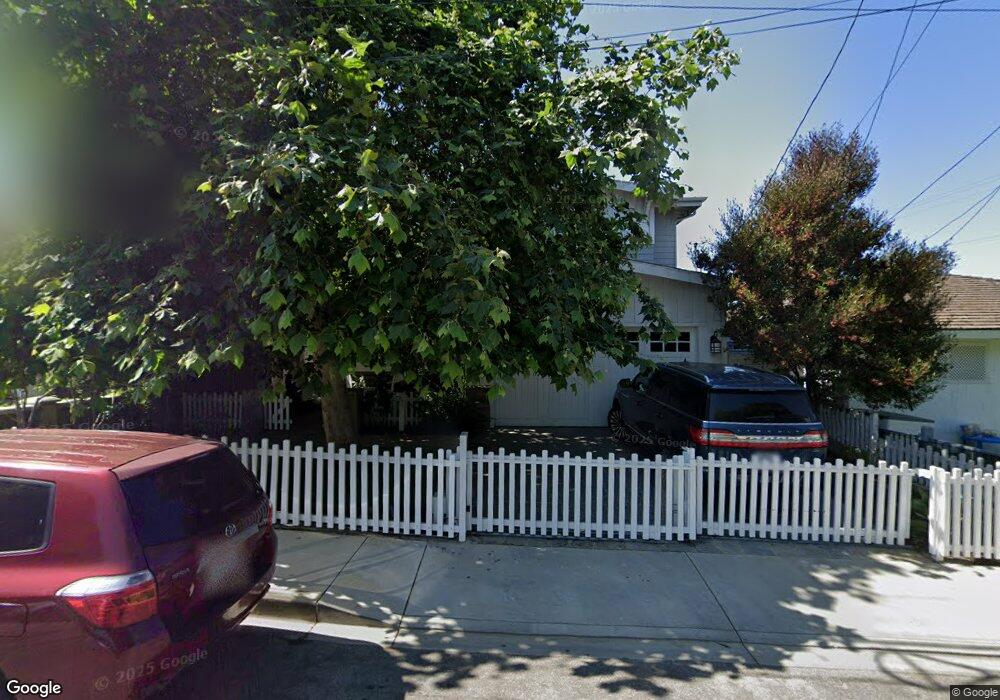
1008 11th St Manhattan Beach, CA 90266
Estimated Value: $5,240,000 - $6,384,000
5
Beds
5
Baths
4,606
Sq Ft
$1,244/Sq Ft
Est. Value
About This Home
This home is located at 1008 11th St, Manhattan Beach, CA 90266 and is currently estimated at $5,731,536, approximately $1,244 per square foot. 1008 11th St is a home located in Los Angeles County with nearby schools including Opal Robinson Elementary School, Manhattan Beach Middle School, and Mira Costa High School.
Ownership History
Date
Name
Owned For
Owner Type
Purchase Details
Closed on
Aug 29, 2007
Sold by
1008 11Th Street Llc
Bought by
Slusser Jonathan and Slusser Jessica
Current Estimated Value
Home Financials for this Owner
Home Financials are based on the most recent Mortgage that was taken out on this home.
Original Mortgage
$280,000
Outstanding Balance
$176,557
Interest Rate
6.67%
Mortgage Type
Credit Line Revolving
Estimated Equity
$5,554,979
Purchase Details
Closed on
Jun 28, 2006
Sold by
Paradissis Philip J and Paradissis Pamela A
Bought by
1008 11Th Street Llc
Home Financials for this Owner
Home Financials are based on the most recent Mortgage that was taken out on this home.
Original Mortgage
$1,685,000
Interest Rate
6.57%
Mortgage Type
Construction
Create a Home Valuation Report for This Property
The Home Valuation Report is an in-depth analysis detailing your home's value as well as a comparison with similar homes in the area
Home Values in the Area
Average Home Value in this Area
Purchase History
| Date | Buyer | Sale Price | Title Company |
|---|---|---|---|
| Slusser Jonathan | $2,880,000 | Lawyers Title | |
| 1008 11Th Street Llc | $1,300,000 | Lawyers Title |
Source: Public Records
Mortgage History
| Date | Status | Borrower | Loan Amount |
|---|---|---|---|
| Open | Slusser Jonathan | $280,000 | |
| Previous Owner | 1008 11Th Street Llc | $1,685,000 |
Source: Public Records
Tax History Compared to Growth
Tax History
| Year | Tax Paid | Tax Assessment Tax Assessment Total Assessment is a certain percentage of the fair market value that is determined by local assessors to be the total taxable value of land and additions on the property. | Land | Improvement |
|---|---|---|---|---|
| 2025 | $42,477 | $3,782,925 | $1,970,274 | $1,812,651 |
| 2024 | $42,477 | $3,708,751 | $1,931,642 | $1,777,109 |
| 2023 | $41,283 | $3,636,031 | $1,893,767 | $1,742,264 |
| 2022 | $40,567 | $3,564,737 | $1,856,635 | $1,708,102 |
| 2021 | $39,808 | $3,494,841 | $1,820,231 | $1,674,610 |
| 2020 | $39,440 | $3,459,006 | $1,801,567 | $1,657,439 |
| 2019 | $38,736 | $3,391,184 | $1,766,243 | $1,624,941 |
| 2018 | $37,923 | $3,324,691 | $1,731,611 | $1,593,080 |
| 2016 | $35,399 | $3,195,591 | $1,664,371 | $1,531,220 |
| 2015 | $34,665 | $3,147,591 | $1,639,371 | $1,508,220 |
| 2014 | $32,082 | $2,895,000 | $1,507,800 | $1,387,200 |
Source: Public Records
Map
Nearby Homes