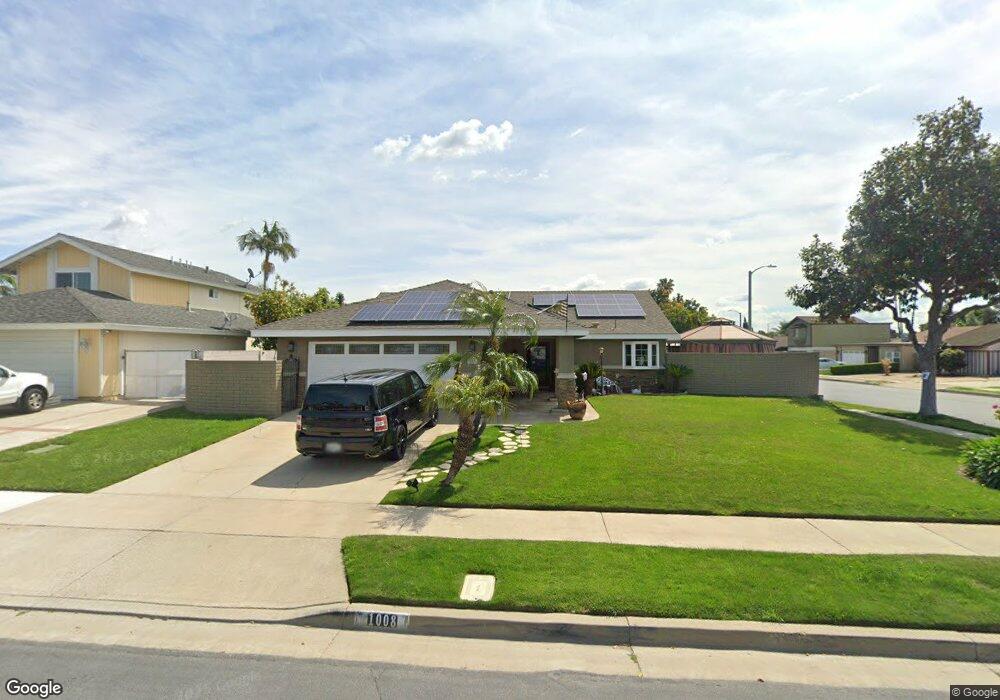
1008 Azalea Ave Placentia, CA 92870
Estimated Value: $925,525 - $1,112,000
3
Beds
2
Baths
1,384
Sq Ft
$756/Sq Ft
Est. Value
About This Home
This home is located at 1008 Azalea Ave, Placentia, CA 92870 and is currently estimated at $1,046,881, approximately $756 per square foot. 1008 Azalea Ave is a home located in Orange County with nearby schools including Morse Avenue Elementary School, Kraemer Middle School, and Valencia High School.
Ownership History
Date
Name
Owned For
Owner Type
Purchase Details
Closed on
May 13, 2025
Sold by
Drown Ronald J and Drown Tamera L
Bought by
Drown Family Living Trust and Drown
Current Estimated Value
Purchase Details
Closed on
Feb 8, 2015
Sold by
Drown Ronald J and Drown Tamera L
Bought by
Drown Ronald J and Drown Tamera L
Home Financials for this Owner
Home Financials are based on the most recent Mortgage that was taken out on this home.
Original Mortgage
$406,000
Interest Rate
3.8%
Mortgage Type
New Conventional
Purchase Details
Closed on
Dec 9, 2003
Sold by
Drown Ronald
Bought by
Drown Ronald J and Drown Tami L
Home Financials for this Owner
Home Financials are based on the most recent Mortgage that was taken out on this home.
Original Mortgage
$306,000
Interest Rate
3.75%
Mortgage Type
Purchase Money Mortgage
Purchase Details
Closed on
Aug 14, 2001
Sold by
Drown Tami
Bought by
Drown Ronald
Home Financials for this Owner
Home Financials are based on the most recent Mortgage that was taken out on this home.
Original Mortgage
$240,000
Interest Rate
6.9%
Create a Home Valuation Report for This Property
The Home Valuation Report is an in-depth analysis detailing your home's value as well as a comparison with similar homes in the area
Home Values in the Area
Average Home Value in this Area
Purchase History
| Date | Buyer | Sale Price | Title Company |
|---|---|---|---|
| Drown Family Living Trust | -- | None Listed On Document | |
| Drown Ronald J | -- | Fidelity National Title | |
| Drown Ronald J | -- | Fidelity National Title | |
| Drown Ronald | -- | Chicago Title Co | |
| Drown Ronald | $300,000 | Chicago Title Co |
Source: Public Records
Mortgage History
| Date | Status | Borrower | Loan Amount |
|---|---|---|---|
| Previous Owner | Drown Ronald J | $406,000 | |
| Previous Owner | Drown Ronald J | $306,000 | |
| Previous Owner | Drown Ronald | $240,000 | |
| Closed | Drown Ronald J | $46,000 |
Source: Public Records
Tax History
| Year | Tax Paid | Tax Assessment Tax Assessment Total Assessment is a certain percentage of the fair market value that is determined by local assessors to be the total taxable value of land and additions on the property. | Land | Improvement |
|---|---|---|---|---|
| 2025 | $5,485 | $443,179 | $319,050 | $124,129 |
| 2024 | $5,485 | $434,490 | $312,794 | $121,696 |
| 2023 | $5,361 | $425,971 | $306,661 | $119,310 |
| 2022 | $5,270 | $417,619 | $300,648 | $116,971 |
| 2021 | $5,133 | $409,431 | $294,753 | $114,678 |
| 2020 | $5,148 | $405,233 | $291,730 | $113,503 |
| 2019 | $4,940 | $397,288 | $286,010 | $111,278 |
| 2018 | $4,876 | $389,499 | $280,402 | $109,097 |
| 2017 | $4,792 | $381,862 | $274,904 | $106,958 |
| 2016 | $4,698 | $374,375 | $269,514 | $104,861 |
| 2015 | $4,636 | $368,752 | $265,466 | $103,286 |
| 2014 | $4,507 | $361,529 | $260,266 | $101,263 |
Source: Public Records
Map
Nearby Homes
- 1126 Naples Ave
- 731 Langer Dr
- 548 Vanderbilt Dr
- 554 Vanderbilt Dr
- 549 Fordham Dr
- 747 De Jesus Dr
- 1234 Verona Place
- 1202 N Ventana Ln
- 1330 Limerick Dr
- 410 N Angelina Dr
- 525 Dickinson Cir
- 1232 E Providence Loop
- 1000 Henrietta Cir
- 1410 Via Cortez
- 988 Spyglass Place
- 337 E Chapman Ave
- 1261 Brian St
- 5142 Hamer Ln
- 212 S Kraemer Blvd Unit 2208
- 102 Kauai Ln
- 1014 Azalea Ave
- 1007 Violet Cir
- 1013 Violet Cir
- 920 Azalea Ave
- 1020 Azalea Ave
- 1019 Violet Cir
- 1009 Azalea Ave
- 612 Sunflower Ave
- 1003 Azalea Ave
- 1015 Azalea Ave
- 618 Sunflower Ave
- 1025 Violet Cir
- 912 Azalea Ave
- 1021 Azalea Ave
- 1026 Azalea Ave
- 624 Sunflower Ave
- 837 Lilac Dr
- 915 Azalea Ave
- 1006 Violet Cir
- 1008 Hibiscus Way
Your Personal Tour Guide
Ask me questions while you tour the home.