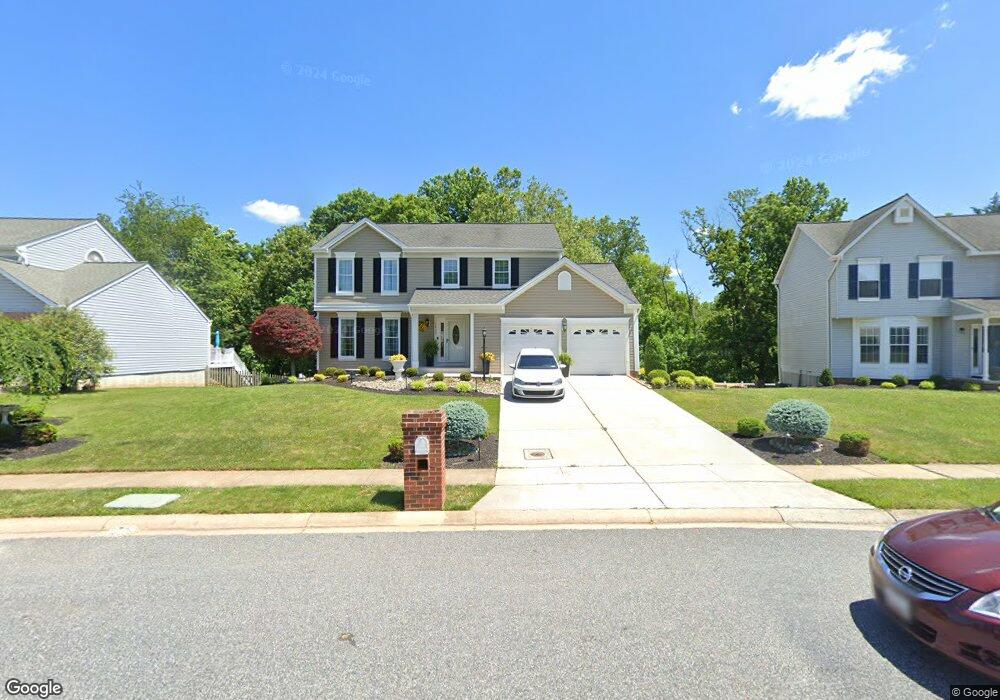
1008 Barrymore Dr Bel Air, MD 21014
Estimated Value: $589,518 - $639,000
--
Bed
3
Baths
2,417
Sq Ft
$257/Sq Ft
Est. Value
About This Home
This home is located at 1008 Barrymore Dr, Bel Air, MD 21014 and is currently estimated at $620,880, approximately $256 per square foot. 1008 Barrymore Dr is a home located in Harford County with nearby schools including Red Pump Elementary School, Fallston Middle School, and Fallston High School.
Ownership History
Date
Name
Owned For
Owner Type
Purchase Details
Closed on
Jul 27, 2020
Sold by
Graden Thomas J and Graden Colleen M
Bought by
Graden Thomas J
Current Estimated Value
Home Financials for this Owner
Home Financials are based on the most recent Mortgage that was taken out on this home.
Original Mortgage
$337,500
Outstanding Balance
$298,264
Interest Rate
2.8%
Mortgage Type
New Conventional
Estimated Equity
$322,616
Purchase Details
Closed on
Mar 11, 1999
Sold by
Constantine Donald S
Bought by
Graden Thomas J and Graden Colleen M
Purchase Details
Closed on
Dec 21, 1995
Sold by
Kent Bruce J
Bought by
Constantine Donald S and Constantine Christina D
Purchase Details
Closed on
Dec 31, 1990
Sold by
Kinnear Robert C
Bought by
Kent Bruce J
Home Financials for this Owner
Home Financials are based on the most recent Mortgage that was taken out on this home.
Original Mortgage
$153,000
Interest Rate
9.68%
Create a Home Valuation Report for This Property
The Home Valuation Report is an in-depth analysis detailing your home's value as well as a comparison with similar homes in the area
Home Values in the Area
Average Home Value in this Area
Purchase History
| Date | Buyer | Sale Price | Title Company |
|---|---|---|---|
| Graden Thomas J | -- | Certified Title Corporation | |
| Graden Thomas J | $175,500 | -- | |
| Constantine Donald S | $176,000 | -- | |
| Kent Bruce J | $171,000 | -- |
Source: Public Records
Mortgage History
| Date | Status | Borrower | Loan Amount |
|---|---|---|---|
| Open | Graden Thomas J | $337,500 | |
| Previous Owner | Kent Bruce J | $153,000 | |
| Closed | Constantine Donald S | -- |
Source: Public Records
Tax History Compared to Growth
Tax History
| Year | Tax Paid | Tax Assessment Tax Assessment Total Assessment is a certain percentage of the fair market value that is determined by local assessors to be the total taxable value of land and additions on the property. | Land | Improvement |
|---|---|---|---|---|
| 2025 | $4,854 | $470,500 | $111,400 | $359,100 |
| 2024 | $4,854 | $445,333 | $0 | $0 |
| 2023 | $4,579 | $420,167 | $0 | $0 |
| 2022 | $4,305 | $395,000 | $111,400 | $283,600 |
| 2021 | $2,156 | $384,300 | $0 | $0 |
| 2020 | $2,156 | $373,600 | $0 | $0 |
| 2019 | $4,188 | $362,900 | $127,100 | $235,800 |
| 2018 | $4,083 | $357,033 | $0 | $0 |
| 2017 | $4,016 | $362,900 | $0 | $0 |
| 2016 | -- | $345,300 | $0 | $0 |
| 2015 | $3,667 | $342,100 | $0 | $0 |
| 2014 | $3,667 | $338,900 | $0 | $0 |
Source: Public Records
Map
Nearby Homes
- 1004 Downing Ct Unit 16
- 904 Martell Ct Unit E
- 903 Garland Ct
- 809 Peppard Dr
- 817 Peppard Dr
- 711 Eastwood Ct
- 1203 N Tollgate Rd
- 1316 Ipswich Dr
- 1322 Locust Ave
- 222 Steed Ln
- 636 Wallingford Rd Unit 2C
- 1516 Cedarwood Dr
- 1346 Vanderbilt Rd
- 296 Canterbury Rd
- 633 Wallingford Rd Unit 404
- 637 Wallingford Rd Unit 102
- 304 Canterbury Rd Unit K
- 1353 Sweetbriar Ln
- 292 Canterbury Rd Unit N
- 752 Roland Ave
- 1006 Barrymore Dr
- 1010 Barrymore Dr
- 1004 Barrymore Dr
- 1012 Barrymore Dr
- 1009 Barrymore Dr
- 1007 Barrymore Dr
- 1002 Barrymore Dr
- 1005 Barrymore Dr
- 1014 Barrymore Dr
- 1011 Barrymore Dr
- 800 Van Dyke Ln
- 1004 Olivier Cir
- 1000 Barrymore Dr
- 1002 Olivier Cir
- 1016 Barrymore Dr
- 1006 Olivier Cir
- 802 Van Dyke Ln
- 703 Lancaster Dr
- 1013 Barrymore Dr
- 1004 Downing Ct Unit 16