1008 Celestial St Unit C8 Cincinnati, OH 45202
Mount Adams NeighborhoodEstimated Value: $436,936 - $575,000
2
Beds
2
Baths
1,596
Sq Ft
$317/Sq Ft
Est. Value
About This Home
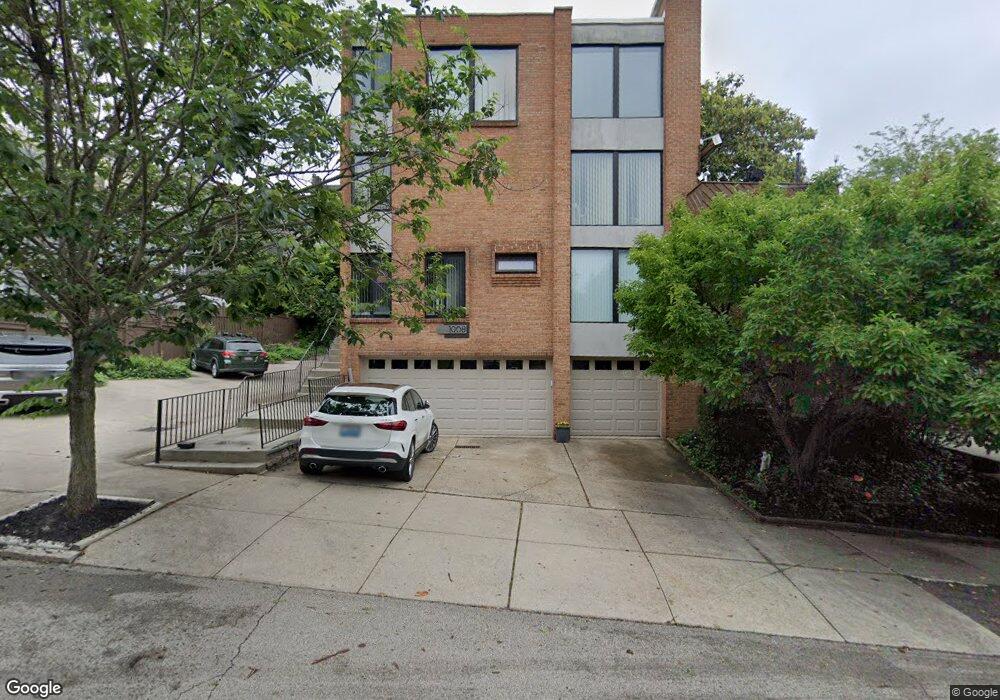
This home is located at 1008 Celestial St Unit C8, Cincinnati, OH 45202 and is currently estimated at $505,234, approximately $316 per square foot. 1008 Celestial St Unit C8 is a home located in Hamilton County with nearby schools including Robert A. Taft Information Technology High School, Withrow University High School, and Clark Montessori High School.
Ownership History
Date
Name
Owned For
Owner Type
Purchase Details
Closed on
Apr 19, 2005
Sold by
Menke Jayne E
Bought by
Rich Yvonne Ann
Current Estimated Value
Home Financials for this Owner
Home Financials are based on the most recent Mortgage that was taken out on this home.
Original Mortgage
$242,000
Outstanding Balance
$123,767
Interest Rate
6.05%
Mortgage Type
Fannie Mae Freddie Mac
Estimated Equity
$381,467
Purchase Details
Closed on
Jan 4, 2002
Sold by
Hardy Elizabeth K Tr
Bought by
Menke Jayne E
Home Financials for this Owner
Home Financials are based on the most recent Mortgage that was taken out on this home.
Original Mortgage
$174,400
Interest Rate
7.12%
Purchase Details
Closed on
May 10, 2000
Sold by
Brown Timothy R
Bought by
Hardy Elizabeth K
Create a Home Valuation Report for This Property
The Home Valuation Report is an in-depth analysis detailing your home's value as well as a comparison with similar homes in the area
Home Values in the Area
Average Home Value in this Area
Purchase History
| Date | Buyer | Sale Price | Title Company |
|---|---|---|---|
| Rich Yvonne Ann | $302,500 | None Available | |
| Menke Jayne E | $218,000 | -- | |
| Hardy Elizabeth K | $202,300 | -- |
Source: Public Records
Mortgage History
| Date | Status | Borrower | Loan Amount |
|---|---|---|---|
| Open | Rich Yvonne Ann | $242,000 | |
| Previous Owner | Menke Jayne E | $174,400 |
Source: Public Records
Tax History
| Year | Tax Paid | Tax Assessment Tax Assessment Total Assessment is a certain percentage of the fair market value that is determined by local assessors to be the total taxable value of land and additions on the property. | Land | Improvement |
|---|---|---|---|---|
| 2025 | $8,076 | $131,299 | $30,800 | $100,499 |
| 2023 | $8,006 | $131,299 | $30,800 | $100,499 |
| 2022 | $7,803 | $114,779 | $38,500 | $76,279 |
| 2021 | $7,513 | $114,779 | $38,500 | $76,279 |
| 2020 | $7,733 | $114,779 | $38,500 | $76,279 |
| 2019 | $7,686 | $104,346 | $35,000 | $69,346 |
| 2018 | $7,697 | $104,346 | $35,000 | $69,346 |
| 2017 | $7,313 | $104,346 | $35,000 | $69,346 |
| 2016 | $6,965 | $98,000 | $37,450 | $60,550 |
| 2015 | $6,279 | $98,000 | $37,450 | $60,550 |
| 2014 | $7,309 | $113,288 | $37,450 | $75,838 |
| 2013 | $6,951 | $105,875 | $35,000 | $70,875 |
Source: Public Records
Map
Nearby Homes
- 949 Pavilion St
- 330 Oregon St
- 1054 Saint Paul Place
- 341 Oregon St
- 1112 Fuller St
- 380 Baum St
- 380 Baum St Unit 5B
- 310 Oregon St
- 328 Oregon St
- 387 Oregon St
- 900 Adams Crossing
- 982 Hatch St
- 502 Baum St
- 981 Paradrome St
- 506 Baum St Unit 1
- 428 Oregon St
- 429 Oregon St
- 1000 Paradrome St
- 971 Parkside Place
- 1040 Hatch St
- 1008 Celestial St Unit C9
- 1008 Celestial St
- 1012 Celestial St
- 1004 Celestial St Unit B5
- 1004 Celestial St Unit 6
- 1004 Celestial St Unit B4
- 1004 Celestial St Unit A
- 1004 Celestial St Unit B
- 1004 Celestial St Unit 4
- 1016 Celestial St
- 1009 Saint Gregory St
- 1011 Saint Gregory St
- 1000 Celestial St
- 1000 Celestial St
- 1000 Celestial St Unit 2
- 1000 Celestial St Unit B
- 1000 Celestial St Unit A
- 1000 Celestial St Unit 1
- 914 Hill St
- 1005 Saint Gregory St
Your Personal Tour Guide
Ask me questions while you tour the home.