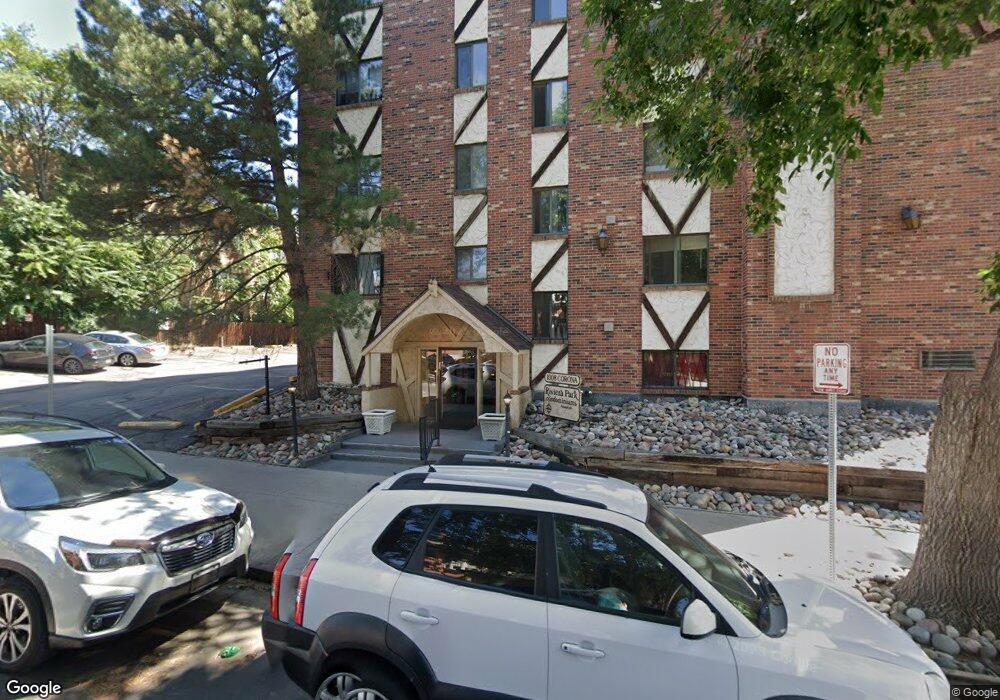
1008 Corona St Unit 603 Denver, CO 80218
Capitol Hill NeighborhoodEstimated Value: $229,444 - $292,000
1
Bed
1
Bath
589
Sq Ft
$431/Sq Ft
Est. Value
About This Home
This home is located at 1008 Corona St Unit 603, Denver, CO 80218 and is currently estimated at $253,611, approximately $430 per square foot. 1008 Corona St Unit 603 is a home located in Denver County with nearby schools including Dora Moore ECE-8 School, Morey Middle School, and East High School.
Ownership History
Date
Name
Owned For
Owner Type
Purchase Details
Closed on
Nov 24, 2009
Sold by
Davies Jeffery B
Bought by
Feiertag Darcey R
Current Estimated Value
Home Financials for this Owner
Home Financials are based on the most recent Mortgage that was taken out on this home.
Original Mortgage
$109,725
Outstanding Balance
$71,679
Interest Rate
4.93%
Mortgage Type
FHA
Estimated Equity
$181,932
Purchase Details
Closed on
Oct 31, 2001
Sold by
Starr Francesca
Bought by
Davies Jeffery B
Home Financials for this Owner
Home Financials are based on the most recent Mortgage that was taken out on this home.
Original Mortgage
$97,650
Interest Rate
6.73%
Mortgage Type
FHA
Purchase Details
Closed on
Jan 24, 1997
Sold by
Suzanne Murray
Bought by
Starr Francesca
Home Financials for this Owner
Home Financials are based on the most recent Mortgage that was taken out on this home.
Original Mortgage
$38,018
Interest Rate
7.73%
Mortgage Type
FHA
Create a Home Valuation Report for This Property
The Home Valuation Report is an in-depth analysis detailing your home's value as well as a comparison with similar homes in the area
Home Values in the Area
Average Home Value in this Area
Purchase History
| Date | Buyer | Sale Price | Title Company |
|---|---|---|---|
| Feiertag Darcey R | $111,750 | Security Title | |
| Davies Jeffery B | $100,000 | Land Title | |
| Starr Francesca | $38,500 | Land Title |
Source: Public Records
Mortgage History
| Date | Status | Borrower | Loan Amount |
|---|---|---|---|
| Open | Feiertag Darcey R | $109,725 | |
| Previous Owner | Davies Jeffery B | $97,650 | |
| Previous Owner | Starr Francesca | $38,018 |
Source: Public Records
Tax History Compared to Growth
Tax History
| Year | Tax Paid | Tax Assessment Tax Assessment Total Assessment is a certain percentage of the fair market value that is determined by local assessors to be the total taxable value of land and additions on the property. | Land | Improvement |
|---|---|---|---|---|
| 2024 | $1,149 | $14,510 | $1,520 | $12,990 |
| 2023 | $1,124 | $14,510 | $1,520 | $12,990 |
| 2022 | $1,294 | $16,270 | $1,580 | $14,690 |
| 2021 | $1,249 | $16,740 | $1,620 | $15,120 |
| 2020 | $1,196 | $16,120 | $1,520 | $14,600 |
| 2019 | $1,163 | $16,120 | $1,520 | $14,600 |
| 2018 | $1,071 | $13,840 | $1,430 | $12,410 |
| 2017 | $1,068 | $13,840 | $1,430 | $12,410 |
| 2016 | $927 | $11,370 | $1,465 | $9,905 |
| 2015 | $888 | $11,370 | $1,465 | $9,905 |
| 2014 | $695 | $8,370 | $1,011 | $7,359 |
Source: Public Records
Map
Nearby Homes
- 1008 N Corona St Unit 604
- 1035 E 10th Ave Unit 6
- 1050 N Corona St Unit 314
- 1050 N Corona St Unit 216
- 1050 N Corona St Unit 105
- 1050 N Corona St Unit 308
- 1050 N Corona St Unit 215
- 985 Corona St Unit 203
- 1010 N Downing St Unit 5
- 1013 E 10th Ave Unit 1013
- 951 N Corona St Unit 5
- 1111 Corona St
- 1056 N Marion St Unit 202
- 1006 E 9th Ave
- 1140 N Downing St Unit 103
- 931 Emerson St Unit 1
- 1151 N Marion St Unit 104
- 1167 N Downing St
- 1090 N Lafayette St Unit 503
- 1029 E 8th Ave Unit 1108
- 1008 Corona St Unit 607
- 1008 Corona St Unit 605
- 1008 Corona St
- 1008 Corona St
- 1008 Corona St
- 1008 Corona St
- 1008 Corona St Unit 507
- 1008 Corona St Unit 506
- 1008 Corona St
- 1008 Corona St Unit 504
- 1008 Corona St Unit 503
- 1008 Corona St
- 1008 Corona St
- 1008 Corona St
- 1008 Corona St Unit 407
- 1008 Corona St Unit 406
- 1008 Corona St
- 1008 Corona St Unit 404
- 1008 Corona St Unit 403
- 1008 Corona St Unit 402