Estimated Value: $1,005,000 - $1,116,000
3
Beds
2
Baths
1,652
Sq Ft
$642/Sq Ft
Est. Value
About This Home
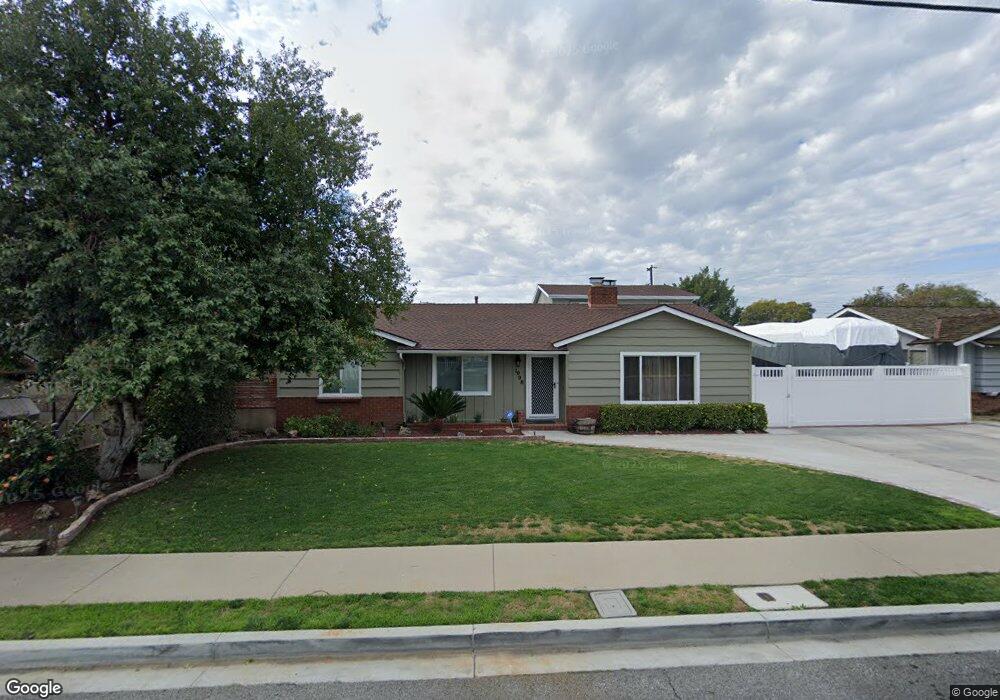
This home is located at 1008 E Elm St, Brea, CA 92821 and is currently estimated at $1,061,140, approximately $642 per square foot. 1008 E Elm St is a home located in Orange County with nearby schools including Arovista Elementary School, Brea Junior High School, and Brea-Olinda High School.
Ownership History
Date
Name
Owned For
Owner Type
Purchase Details
Closed on
Dec 17, 2025
Sold by
Campbell Mark J
Bought by
Julie Lynn Cameron Trust and Cameron
Current Estimated Value
Home Financials for this Owner
Home Financials are based on the most recent Mortgage that was taken out on this home.
Original Mortgage
$819,000
Outstanding Balance
$817,436
Interest Rate
6.23%
Mortgage Type
New Conventional
Estimated Equity
$243,704
Purchase Details
Closed on
May 21, 2019
Sold by
Cameron Julie L
Bought by
The Julie Lynn Cameron Trust
Purchase Details
Closed on
Oct 21, 2015
Sold by
Campbell Mark J
Bought by
Campbell Mark J and Cameron Julie L
Home Financials for this Owner
Home Financials are based on the most recent Mortgage that was taken out on this home.
Original Mortgage
$450,000
Interest Rate
3.81%
Mortgage Type
New Conventional
Purchase Details
Closed on
Sep 10, 2001
Sold by
Campbell Mark J and Campbell Cynthia A
Bought by
Campbell Mark J
Home Financials for this Owner
Home Financials are based on the most recent Mortgage that was taken out on this home.
Original Mortgage
$240,000
Interest Rate
7%
Mortgage Type
Purchase Money Mortgage
Create a Home Valuation Report for This Property
The Home Valuation Report is an in-depth analysis detailing your home's value as well as a comparison with similar homes in the area
Home Values in the Area
Average Home Value in this Area
Purchase History
| Date | Buyer | Sale Price | Title Company |
|---|---|---|---|
| Julie Lynn Cameron Trust | -- | First American Title | |
| The Julie Lynn Cameron Trust | -- | None Available | |
| Campbell Mark J | -- | Fidelity National Title | |
| Campbell Mark J | -- | American Title Co |
Source: Public Records
Mortgage History
| Date | Status | Borrower | Loan Amount |
|---|---|---|---|
| Open | Julie Lynn Cameron Trust | $819,000 | |
| Previous Owner | Campbell Mark J | $450,000 | |
| Previous Owner | Campbell Mark J | $240,000 |
Source: Public Records
Tax History
| Year | Tax Paid | Tax Assessment Tax Assessment Total Assessment is a certain percentage of the fair market value that is determined by local assessors to be the total taxable value of land and additions on the property. | Land | Improvement |
|---|---|---|---|---|
| 2025 | $5,871 | $517,013 | $241,228 | $275,785 |
| 2024 | $5,871 | $506,876 | $236,498 | $270,378 |
| 2023 | $5,707 | $496,938 | $231,861 | $265,077 |
| 2022 | $5,651 | $487,195 | $227,315 | $259,880 |
| 2021 | $5,545 | $477,643 | $222,858 | $254,785 |
| 2020 | $5,507 | $472,746 | $220,573 | $252,173 |
| 2019 | $5,058 | $435,922 | $216,248 | $219,674 |
| 2018 | $4,228 | $358,986 | $212,008 | $146,978 |
| 2017 | $3,593 | $301,548 | $207,851 | $93,697 |
| 2016 | $3,522 | $295,636 | $203,776 | $91,860 |
| 2015 | $3,471 | $291,196 | $200,715 | $90,481 |
| 2014 | $3,371 | $285,492 | $196,783 | $88,709 |
Source: Public Records
Map
Nearby Homes
- 3059 Heather Dr
- 633 Laurel Ave
- 425 Cherry St
- 677 Magnolia Ave
- 522 S Brea Blvd
- 3000 Associated Rd Unit 60
- 3054 Associated Rd Unit 20
- 127 S Redwood Ave
- 145 S Poplar Ave Unit 20
- 2775 Pine Creek Cir Unit 116
- 334 S Walnut Ave
- 2733 Quail Ridge Cir Unit 32
- 2851 Rolling Hills Dr Unit 178
- 2851 Rolling Hills Dr Unit 257
- 2851 Rolling Hills Dr Unit 248
- 2851 Rolling Hills Dr
- 2740 Craig Cir
- 114 Juniper St
- 1796 Ravencrest Dr
- 404 Sievers Ave
Your Personal Tour Guide
Ask me questions while you tour the home.