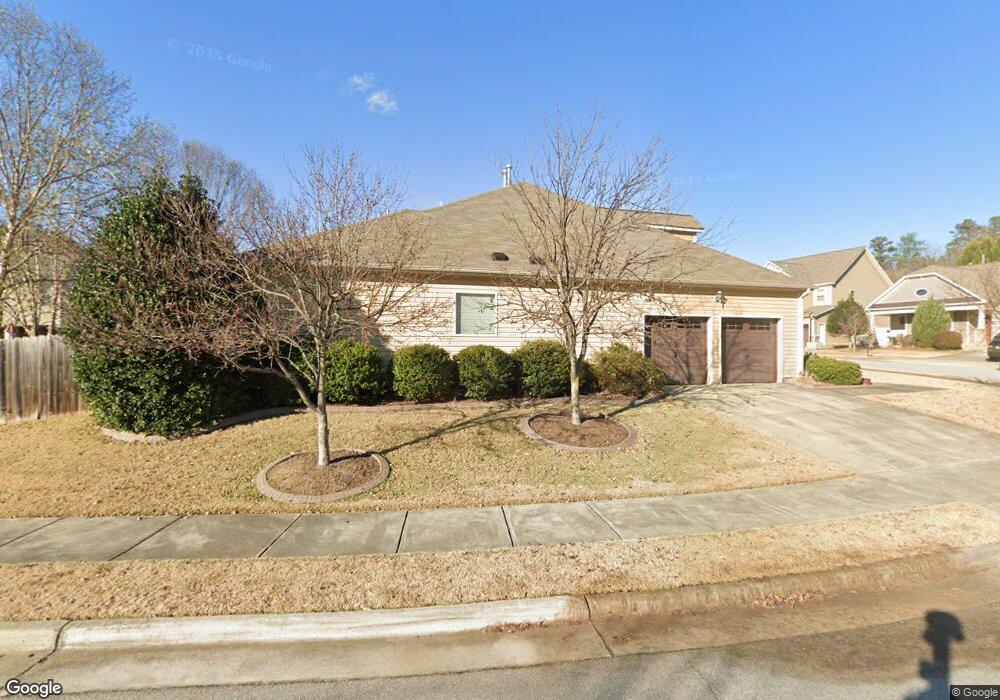
1008 Finley Point Place Knightdale, NC 27545
Shotwell NeighborhoodEstimated Value: $381,685 - $446,000
3
Beds
3
Baths
1,771
Sq Ft
$239/Sq Ft
Est. Value
About This Home
This home is located at 1008 Finley Point Place, Knightdale, NC 27545 and is currently estimated at $423,171, approximately $238 per square foot. 1008 Finley Point Place is a home located in Wake County with nearby schools including Hodge Road Elementary School, Neuse River Middle School, and Knightdale High.
Ownership History
Date
Name
Owned For
Owner Type
Purchase Details
Closed on
Dec 30, 2010
Sold by
Cheswick By Terramor Homes Llc
Bought by
Clark Gwendolyn C
Current Estimated Value
Home Financials for this Owner
Home Financials are based on the most recent Mortgage that was taken out on this home.
Original Mortgage
$207,247
Outstanding Balance
$138,840
Interest Rate
4.42%
Mortgage Type
VA
Estimated Equity
$284,331
Purchase Details
Closed on
Oct 25, 2010
Sold by
Panther Rock Llc
Bought by
Terramor Homes Inc
Home Financials for this Owner
Home Financials are based on the most recent Mortgage that was taken out on this home.
Original Mortgage
$153,750
Interest Rate
4.39%
Mortgage Type
Purchase Money Mortgage
Create a Home Valuation Report for This Property
The Home Valuation Report is an in-depth analysis detailing your home's value as well as a comparison with similar homes in the area
Home Values in the Area
Average Home Value in this Area
Purchase History
| Date | Buyer | Sale Price | Title Company |
|---|---|---|---|
| Clark Gwendolyn C | $198,000 | None Available | |
| Reid Mary S | $201,000 | None Available | |
| Terramor Homes Inc | $45,000 | None Available |
Source: Public Records
Mortgage History
| Date | Status | Borrower | Loan Amount |
|---|---|---|---|
| Open | Reid Mary S | $207,247 | |
| Closed | Reid Mary S | $130,000 | |
| Previous Owner | Terramor Homes Inc | $153,750 |
Source: Public Records
Tax History Compared to Growth
Tax History
| Year | Tax Paid | Tax Assessment Tax Assessment Total Assessment is a certain percentage of the fair market value that is determined by local assessors to be the total taxable value of land and additions on the property. | Land | Improvement |
|---|---|---|---|---|
| 2025 | $3,405 | $353,652 | $85,000 | $268,652 |
| 2024 | $3,392 | $353,652 | $85,000 | $268,652 |
| 2023 | $2,859 | $256,448 | $60,000 | $196,448 |
| 2022 | $2,763 | $256,448 | $60,000 | $196,448 |
| 2021 | $2,636 | $256,448 | $60,000 | $196,448 |
| 2020 | $2,636 | $256,448 | $60,000 | $196,448 |
| 2019 | $2,430 | $209,411 | $45,000 | $164,411 |
| 2018 | $2,291 | $209,411 | $45,000 | $164,411 |
| 2017 | $2,208 | $209,411 | $45,000 | $164,411 |
| 2016 | $2,178 | $209,411 | $45,000 | $164,411 |
| 2015 | $2,229 | $211,489 | $42,000 | $169,489 |
| 2014 | -- | $211,489 | $42,000 | $169,489 |
Source: Public Records
Map
Nearby Homes
- 1102 Ranchester Rd
- 1027 Finley Point Place
- 1053 Hardin Hill Ln
- 1061 Hardin Hill Ln
- 920 Delano Dr
- 1205 Brook Bluff Rd
- 817 Junto St
- 1510 Lena Ln
- Charlotte II Plan at Silverstone - Terraces
- Savannah Plan at Silverstone - Terraces
- Bedford Plan at Silverstone - Traditional
- Augusta Plan at Silverstone - Terraces
- Charleston Plan at Silverstone - Terraces
- Sheridan Plan at Silverstone - Traditional
- Wayland Plan at Silverstone - Traditional
- Greystone Plan at Silverstone - Townes
- Cobblestone Plan at Silverstone - Townes
- 424 Rowe Way
- 1013 Dillon Lake Dr
- 1017 Dillon Lake Dr
- 1004 Finley Point Place
- 1105 Ranchester Rd
- 1002 Finley Point Place
- 1017 Finley Point Place
- 1019 Finley Point Place
- 1107 Ranchester Rd
- 1007 Finley Point Place
- 1005 Finley Point Place
- 1021 Finley Point Place
- 1009 Finley Point Place
- 1015 Finley Point Place
- 1003 Finley Point Place
- 1023 Finley Point Place
- 1102 Ranchester Rd
- 1011 Finley Point Place
- 1001 Finley Point Place
- 1025 Finley Point Place
- 1013 Finley Point Place
- 1106 Ranchester Rd
- 1104 Ranchester Rd