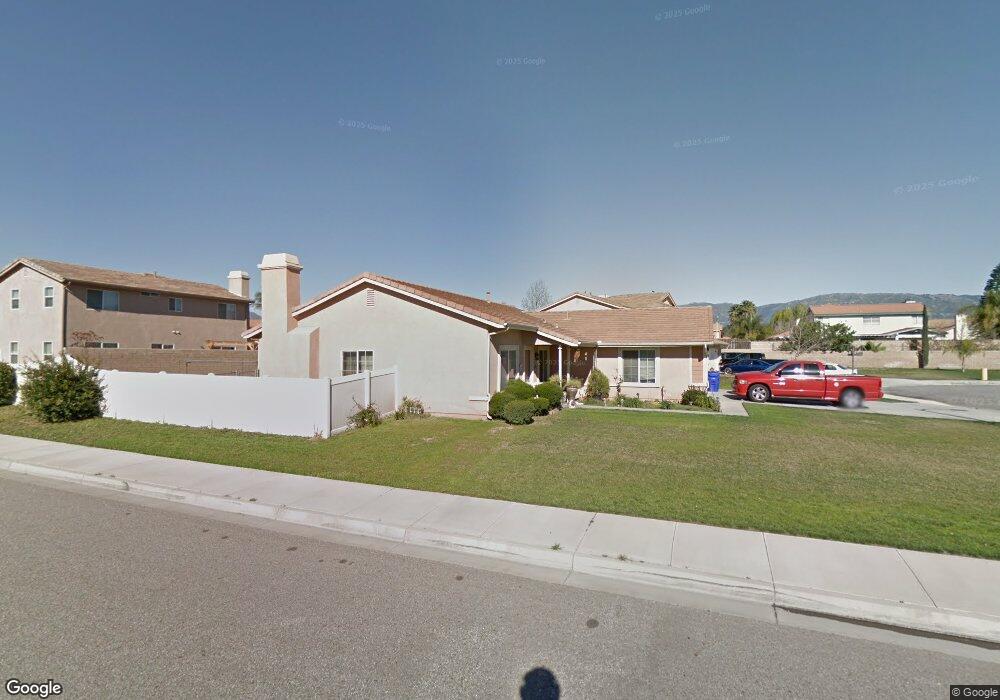
1008 N Burney Ave Rialto, CA 92376
Estimated Value: $567,066 - $599,000
4
Beds
2
Baths
1,610
Sq Ft
$364/Sq Ft
Est. Value
About This Home
This home is located at 1008 N Burney Ave, Rialto, CA 92376 and is currently estimated at $586,017, approximately $363 per square foot. 1008 N Burney Ave is a home located in San Bernardino County with nearby schools including Myers Elementary School, Frisbie Middle School, and Eisenhower High School.
Ownership History
Date
Name
Owned For
Owner Type
Purchase Details
Closed on
Apr 30, 2021
Sold by
Ly Bryan L and Fung Catherine K
Bought by
Lundi Properties Llc
Current Estimated Value
Purchase Details
Closed on
Feb 20, 2004
Sold by
Walton Development Llc
Bought by
Ly Bryan L
Home Financials for this Owner
Home Financials are based on the most recent Mortgage that was taken out on this home.
Original Mortgage
$200,000
Interest Rate
5.82%
Mortgage Type
New Conventional
Create a Home Valuation Report for This Property
The Home Valuation Report is an in-depth analysis detailing your home's value as well as a comparison with similar homes in the area
Home Values in the Area
Average Home Value in this Area
Purchase History
| Date | Buyer | Sale Price | Title Company |
|---|---|---|---|
| Lundi Properties Llc | -- | None Available | |
| Ly Bryan L | -- | None Available | |
| Ly Bryan L | $257,500 | Chicago Title Company |
Source: Public Records
Mortgage History
| Date | Status | Borrower | Loan Amount |
|---|---|---|---|
| Previous Owner | Ly Bryan L | $200,000 |
Source: Public Records
Tax History Compared to Growth
Tax History
| Year | Tax Paid | Tax Assessment Tax Assessment Total Assessment is a certain percentage of the fair market value that is determined by local assessors to be the total taxable value of land and additions on the property. | Land | Improvement |
|---|---|---|---|---|
| 2025 | $4,643 | $358,867 | $90,606 | $268,261 |
| 2024 | $4,643 | $351,830 | $88,829 | $263,001 |
| 2023 | $4,931 | $344,931 | $87,087 | $257,844 |
| 2022 | $4,601 | $338,167 | $85,379 | $252,788 |
| 2021 | $4,574 | $331,536 | $83,705 | $247,831 |
| 2020 | $4,602 | $328,137 | $82,847 | $245,290 |
| 2019 | $4,504 | $321,703 | $81,223 | $240,480 |
| 2018 | $4,381 | $315,395 | $79,630 | $235,765 |
| 2017 | $4,351 | $309,211 | $78,069 | $231,142 |
| 2016 | $4,306 | $303,148 | $76,538 | $226,610 |
| 2015 | $4,198 | $290,000 | $102,000 | $188,000 |
| 2014 | $3,418 | $241,000 | $84,000 | $157,000 |
Source: Public Records
Map
Nearby Homes
- 917 E Jackson St
- 1014 E Jackson St
- 2678 Etiwanda Ave
- 2606 Maple St
- 2837 7th St
- 857 N Dallas Ave
- 665 N Pepper Ave
- 648 N Rosalind Ave
- 820 San Carlo Ave
- 2495 Etiwanda Ave
- 1010 Terrace Rd Unit 52
- 1010 Terrace Rd Unit 38
- 1010 Terrace Rd Unit 177
- 1010 Terrace Rd
- 1010 Terrace Rd Unit 19
- 668 N Mulberry Ave
- 556 N Marvin Dr
- 565 N Meridian Ave
- 555 N Meridian Ave
- 559 N Marvin Dr
- 1020 N Burney Ave
- 1001 N Evaline Ct
- 1013 N Evaline Ct
- 1003 E Madrona St
- 1015 E Madrona St
- 987 E Madrona St
- 1007 N Burney Ave
- 1005 E Wabash St
- 1019 N Burney Ave
- 1017 E Wabash St
- 983 E Wabash St
- 1027 E Madrona St
- 973 E Madrona St
- 1029 E Wabash St
- 971 E Wabash St
- 10040 N Evaline Ct
- 2794 W 9th St
- 2794 9th St
- 2804 9th St
- 2782 9th St