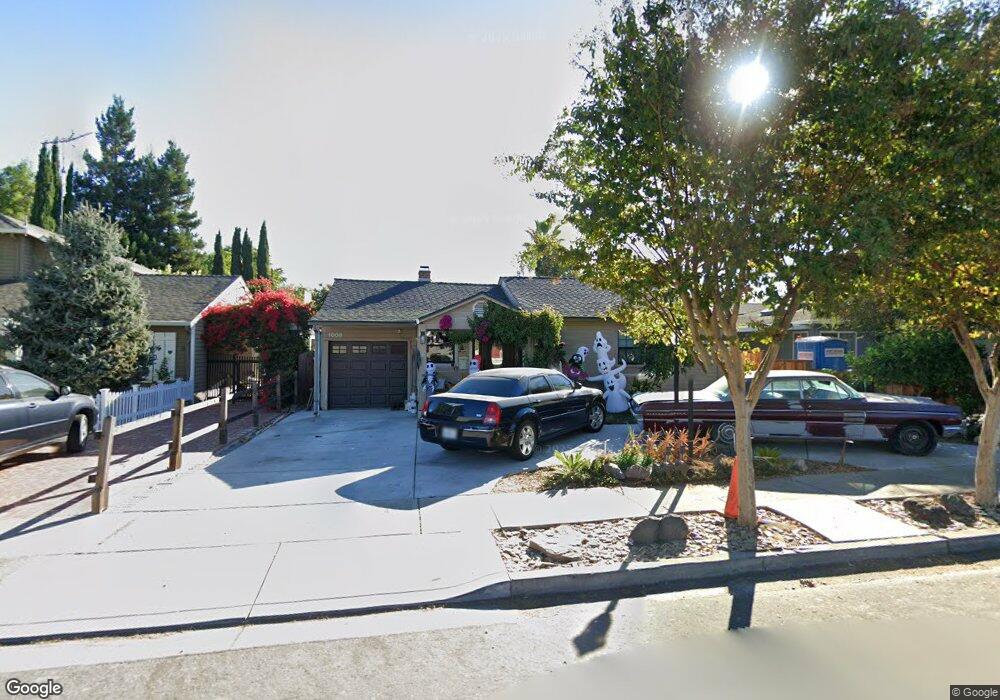
1008 Thornton Way San Jose, CA 95128
Fruitdale NeighborhoodEstimated Value: $1,574,000 - $1,651,000
2
Beds
2
Baths
1,558
Sq Ft
$1,035/Sq Ft
Est. Value
About This Home
This home is located at 1008 Thornton Way, San Jose, CA 95128 and is currently estimated at $1,612,836, approximately $1,035 per square foot. 1008 Thornton Way is a home located in Santa Clara County with nearby schools including Del Mar High School, Sherman Oaks Elementary School, and Monroe Middle School.
Ownership History
Date
Name
Owned For
Owner Type
Purchase Details
Closed on
Mar 31, 2021
Sold by
Macbride Sean and Macbride Anthony
Bought by
Macbride Sean and The Sean Macbride Living Trust
Current Estimated Value
Purchase Details
Closed on
May 8, 2020
Sold by
Macbride Sean
Bought by
Macbride Sean and Macbride Anthony
Purchase Details
Closed on
Oct 28, 2008
Sold by
Dibenedetto Nicholas A
Bought by
Macbride Sean
Home Financials for this Owner
Home Financials are based on the most recent Mortgage that was taken out on this home.
Original Mortgage
$342,400
Outstanding Balance
$221,288
Interest Rate
5.77%
Mortgage Type
Purchase Money Mortgage
Estimated Equity
$1,391,548
Purchase Details
Closed on
Nov 30, 2002
Sold by
Dibenedetto Paula M Collins
Bought by
Dibenedetto Nicholas A
Purchase Details
Closed on
Jul 23, 1999
Sold by
Dibenedetto Nicholas A
Bought by
Dibenedetto Nicholas A and Dibenedetto Paula M Collins
Home Financials for this Owner
Home Financials are based on the most recent Mortgage that was taken out on this home.
Original Mortgage
$140,000
Interest Rate
7.64%
Create a Home Valuation Report for This Property
The Home Valuation Report is an in-depth analysis detailing your home's value as well as a comparison with similar homes in the area
Home Values in the Area
Average Home Value in this Area
Purchase History
| Date | Buyer | Sale Price | Title Company |
|---|---|---|---|
| Macbride Sean | -- | None Available | |
| Macbride Sean | -- | None Available | |
| Macbride Sean | $428,000 | North American Title Company | |
| Dibenedetto Nicholas A | -- | -- | |
| Dibenedetto Nicholas A | -- | Commonwealth Title |
Source: Public Records
Mortgage History
| Date | Status | Borrower | Loan Amount |
|---|---|---|---|
| Open | Macbride Sean | $342,400 | |
| Previous Owner | Dibenedetto Nicholas A | $140,000 |
Source: Public Records
Tax History Compared to Growth
Tax History
| Year | Tax Paid | Tax Assessment Tax Assessment Total Assessment is a certain percentage of the fair market value that is determined by local assessors to be the total taxable value of land and additions on the property. | Land | Improvement |
|---|---|---|---|---|
| 2025 | $7,391 | $551,146 | $450,710 | $100,436 |
| 2024 | $7,391 | $540,340 | $441,873 | $98,467 |
| 2023 | $7,292 | $529,746 | $433,209 | $96,537 |
| 2022 | $7,272 | $519,360 | $424,715 | $94,645 |
| 2021 | $7,142 | $509,178 | $416,388 | $92,790 |
| 2020 | $6,986 | $503,958 | $412,119 | $91,839 |
| 2019 | $6,880 | $494,078 | $404,039 | $90,039 |
| 2018 | $6,709 | $484,391 | $396,117 | $88,274 |
| 2017 | $6,603 | $474,894 | $388,350 | $86,544 |
| 2016 | $6,204 | $465,584 | $380,736 | $84,848 |
| 2015 | $6,085 | $458,591 | $375,017 | $83,574 |
| 2014 | $5,836 | $449,608 | $367,671 | $81,937 |
Source: Public Records
Map
Nearby Homes
- 1023 Delna Manor Ln Unit Lane
- 1189 N Central Ave
- 2958 Neet Ave
- 744 Teatree Ct
- 1006 Almarida Dr
- 680 Teatree Ct
- 1019 Lenor Way
- 3067 Greentree Way
- 919 Ravenscourt Ave
- 1114 S Winchester Blvd Unit 1114
- 584 Macarthur Ave
- 1405 Allegado Alley Unit 86
- 621 La Maison Dr Unit 20
- 138 Quail Hollow Dr Unit 138
- 2067 Sonador Commons
- 2043 Sonador Commons
- 509 Laswell Ave
- 801 S Winchester Blvd Unit 2304
- 801 S Winchester Blvd Unit 2401
- 801 S Winchester Blvd Unit 3206
- 1016 Thornton Way
- 1000 Thornton Way
- 1024 Thornton Way
- 990 Thornton Way
- 1032 Thornton Way
- 1009 Empey Way
- 1017 Empey Way
- 1001 Empey Way
- 980 Thornton Way
- 1025 Empey Way
- 991 Empey Way
- 1040 Thornton Way
- 1009 Thornton Way
- 1033 Empey Way
- 1017 Thornton Way
- 1001 Thornton Way
- 1025 Thornton Way
- 993 Thornton Way
- 1048 Thornton Way
- 1041 Empey Way