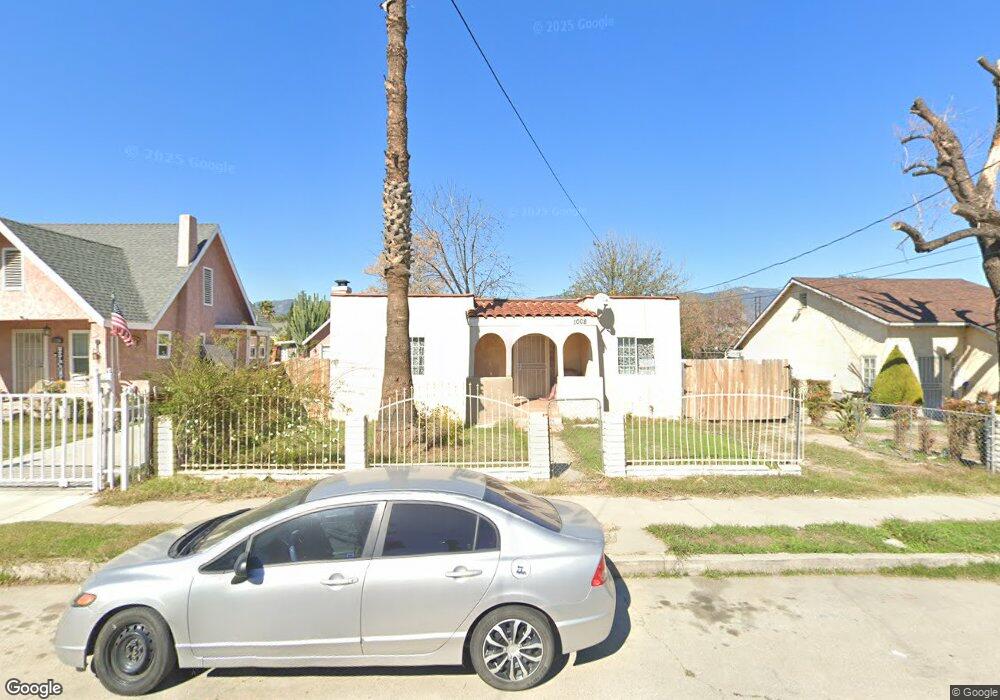
1008 W 15th St San Bernardino, CA 92411
Roosevelt NeighborhoodEstimated Value: $388,000 - $435,000
2
Beds
1
Bath
862
Sq Ft
$483/Sq Ft
Est. Value
About This Home
This home is located at 1008 W 15th St, San Bernardino, CA 92411 and is currently estimated at $416,624, approximately $483 per square foot. 1008 W 15th St is a home located in San Bernardino County with nearby schools including Roosevelt Elementary School, Dr. Martin Luther King Jr. Middle School, and San Bernardino High School.
Ownership History
Date
Name
Owned For
Owner Type
Purchase Details
Closed on
May 14, 2010
Sold by
Hsbc Bank Usa Na
Bought by
Herrera Martha
Current Estimated Value
Purchase Details
Closed on
Dec 7, 2009
Sold by
Jimenez Maura
Bought by
Hsbc Bank Usa Na
Purchase Details
Closed on
Oct 25, 2006
Sold by
Ibarra Blas
Bought by
Jimenez Maura
Home Financials for this Owner
Home Financials are based on the most recent Mortgage that was taken out on this home.
Original Mortgage
$221,000
Interest Rate
9.25%
Mortgage Type
Balloon
Purchase Details
Closed on
Jul 29, 2005
Sold by
Ibarra Blas and Ibarra Silvia
Bought by
Ibarra Blas
Home Financials for this Owner
Home Financials are based on the most recent Mortgage that was taken out on this home.
Original Mortgage
$148,500
Interest Rate
1%
Mortgage Type
Negative Amortization
Create a Home Valuation Report for This Property
The Home Valuation Report is an in-depth analysis detailing your home's value as well as a comparison with similar homes in the area
Home Values in the Area
Average Home Value in this Area
Purchase History
| Date | Buyer | Sale Price | Title Company |
|---|---|---|---|
| Herrera Martha | $54,500 | Lsi Title Company | |
| Hsbc Bank Usa Na | $125,130 | Accommodation | |
| Jimenez Maura | $260,000 | Chicago Title Company | |
| Ibarra Blas | -- | Landsafe Rancho Cucamonga |
Source: Public Records
Mortgage History
| Date | Status | Borrower | Loan Amount |
|---|---|---|---|
| Previous Owner | Jimenez Maura | $221,000 | |
| Previous Owner | Ibarra Blas | $148,500 |
Source: Public Records
Tax History Compared to Growth
Tax History
| Year | Tax Paid | Tax Assessment Tax Assessment Total Assessment is a certain percentage of the fair market value that is determined by local assessors to be the total taxable value of land and additions on the property. | Land | Improvement |
|---|---|---|---|---|
| 2025 | $1,498 | $108,168 | $32,450 | $75,718 |
| 2024 | $1,498 | $106,047 | $31,814 | $74,233 |
| 2023 | $1,460 | $103,967 | $31,190 | $72,777 |
| 2022 | $1,460 | $101,928 | $30,578 | $71,350 |
| 2021 | $1,459 | $99,929 | $29,978 | $69,951 |
| 2020 | $1,460 | $98,905 | $29,671 | $69,234 |
| 2019 | $1,419 | $96,965 | $29,089 | $67,876 |
| 2018 | $1,405 | $95,064 | $28,519 | $66,545 |
| 2017 | $1,041 | $60,614 | $16,126 | $44,488 |
| 2016 | $913 | $59,426 | $15,810 | $43,616 |
| 2015 | $1,204 | $58,534 | $15,573 | $42,961 |
| 2014 | $757 | $57,387 | $15,268 | $42,119 |
Source: Public Records
Map
Nearby Homes
- 994 Magnolia Ave
- 964 W 14th St
- 1278 Perris St
- 1391 N Crescent Ave
- 1190 W 14th St
- 738 W 18th St Unit 2
- 1189 W 19th St
- 0 N Mt Vernon Ave Unit OC25230729
- 1256 W Base Line St
- 1263 N Mount Vernon Ave
- 1963 Turrill Ave
- 772 W 20th St
- 0 N Garner Ave
- 1364 W 15th St
- 1330 Acacia Ave
- 1263 W Baseline St
- 1708 N Mount Vernon Ave
- 1202 W 11th St
- 1372 N E St
- 507 W 17th St