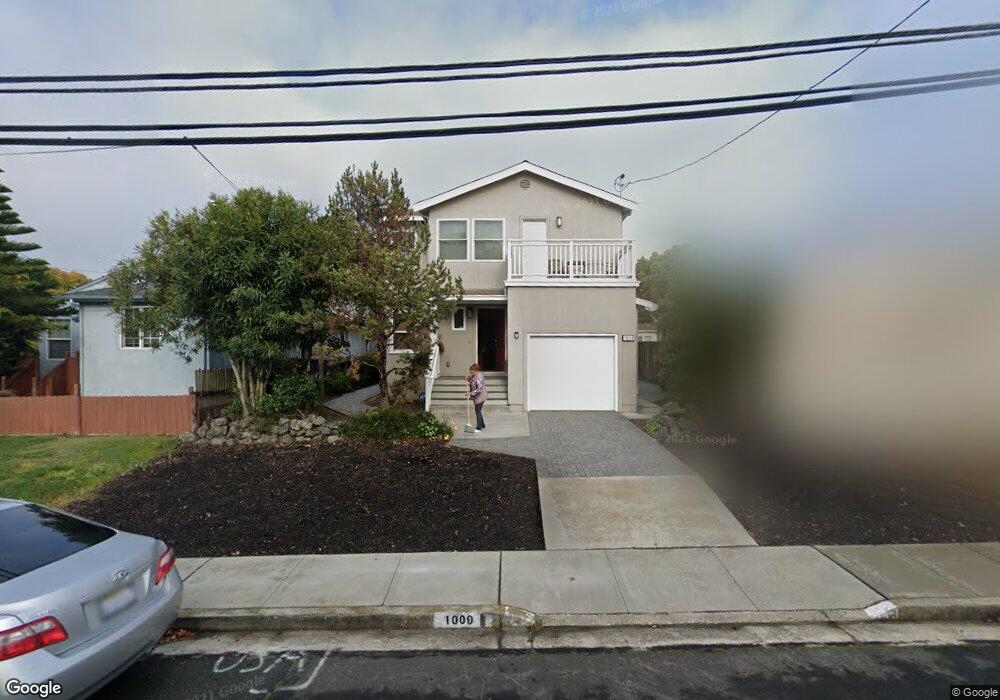
1009 E 3rd St Benicia, CA 94510
Estimated Value: $705,012 - $793,000
2
Beds
1
Bath
778
Sq Ft
$963/Sq Ft
Est. Value
About This Home
This home is located at 1009 E 3rd St, Benicia, CA 94510 and is currently estimated at $749,253, approximately $963 per square foot. 1009 E 3rd St is a home located in Solano County with nearby schools including Mary Farmar Elementary School, Benicia Middle School, and Benicia High School.
Ownership History
Date
Name
Owned For
Owner Type
Purchase Details
Closed on
Feb 11, 2010
Sold by
Olson Lawrence Martin George and The Ox Team Trust
Bought by
Dokko Gina
Current Estimated Value
Home Financials for this Owner
Home Financials are based on the most recent Mortgage that was taken out on this home.
Original Mortgage
$180,000
Outstanding Balance
$119,070
Interest Rate
5.02%
Mortgage Type
New Conventional
Estimated Equity
$630,183
Purchase Details
Closed on
May 2, 2003
Sold by
Va
Bought by
Olson William C
Purchase Details
Closed on
Oct 22, 2002
Sold by
Olson William C
Bought by
Olson William C and The Ox Team Trust
Create a Home Valuation Report for This Property
The Home Valuation Report is an in-depth analysis detailing your home's value as well as a comparison with similar homes in the area
Home Values in the Area
Average Home Value in this Area
Purchase History
| Date | Buyer | Sale Price | Title Company |
|---|---|---|---|
| Dokko Gina | $225,000 | Old Republic Title Company | |
| Olson William C | -- | -- | |
| Olson William C | -- | -- |
Source: Public Records
Mortgage History
| Date | Status | Borrower | Loan Amount |
|---|---|---|---|
| Open | Dokko Gina | $180,000 |
Source: Public Records
Tax History
| Year | Tax Paid | Tax Assessment Tax Assessment Total Assessment is a certain percentage of the fair market value that is determined by local assessors to be the total taxable value of land and additions on the property. | Land | Improvement |
|---|---|---|---|---|
| 2025 | $4,313 | $374,617 | $83,897 | $290,720 |
| 2024 | $4,313 | $367,272 | $82,252 | $285,020 |
| 2023 | $4,207 | $360,072 | $80,640 | $279,432 |
| 2022 | $4,128 | $353,012 | $79,059 | $273,953 |
| 2021 | $4,042 | $346,091 | $77,509 | $268,582 |
| 2020 | $3,988 | $342,544 | $76,715 | $265,829 |
| 2019 | $3,917 | $335,828 | $75,211 | $260,617 |
| 2018 | $3,815 | $329,244 | $73,737 | $255,507 |
| 2017 | $3,624 | $314,162 | $72,292 | $241,870 |
| 2016 | $3,649 | $308,003 | $70,875 | $237,128 |
| 2015 | $3,555 | $303,378 | $69,811 | $233,567 |
| 2014 | $3,512 | $297,436 | $68,444 | $228,992 |
Source: Public Records
Map
Nearby Homes
Your Personal Tour Guide
Ask me questions while you tour the home.