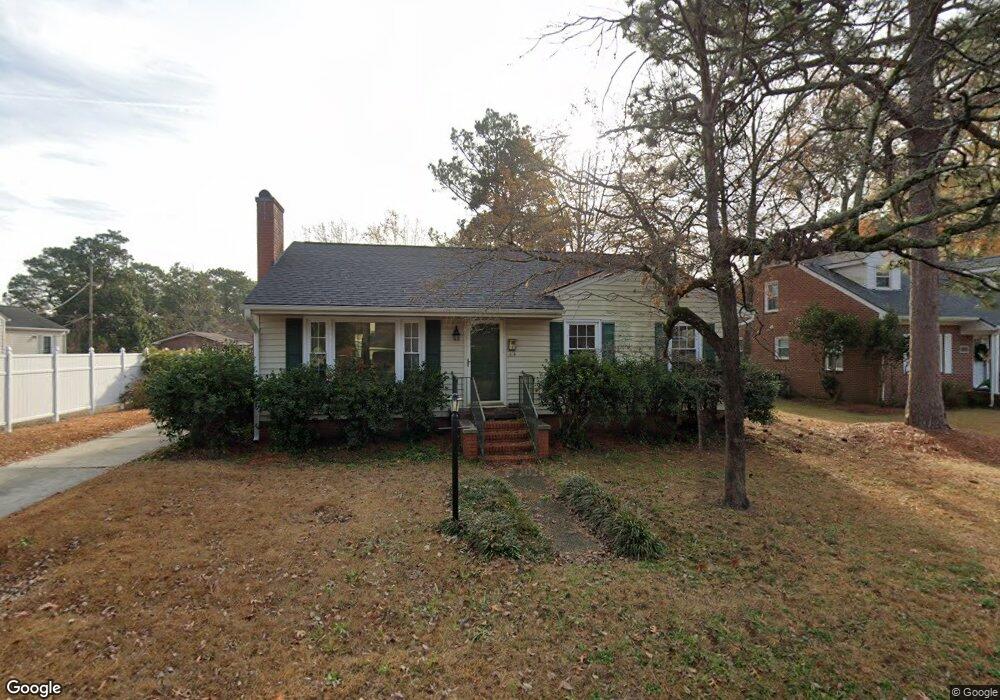
1009 S 2nd St Smithfield, NC 27577
Estimated Value: $193,000 - $240,000
3
Beds
1
Bath
1,192
Sq Ft
$185/Sq Ft
Est. Value
About This Home
This home is located at 1009 S 2nd St, Smithfield, NC 27577 and is currently estimated at $220,285, approximately $184 per square foot. 1009 S 2nd St is a home located in Johnston County with nearby schools including South Smithfield Elementary School, Smithfield Middle School, and Smithfield-Selma High School.
Ownership History
Date
Name
Owned For
Owner Type
Purchase Details
Closed on
Aug 27, 2021
Sold by
Jones Nancy Darlene Daughtery
Bought by
Jones Nancy Darlene Daughtery
Current Estimated Value
Purchase Details
Closed on
Apr 20, 2020
Sold by
Langdon Joshua I
Bought by
Jones Norwood G and Jones Nancy Darlene
Purchase Details
Closed on
Apr 7, 2011
Sold by
Langdon Kathryn Elizabeth
Bought by
Langdon Joshua Isaac
Purchase Details
Closed on
Apr 17, 2007
Sold by
Langdon George Mack
Bought by
Langdon Joshua I
Home Financials for this Owner
Home Financials are based on the most recent Mortgage that was taken out on this home.
Original Mortgage
$70,400
Interest Rate
7.25%
Mortgage Type
Purchase Money Mortgage
Purchase Details
Closed on
Sep 8, 2005
Sold by
Langdon Lori Wood
Bought by
Langdon George Mack
Create a Home Valuation Report for This Property
The Home Valuation Report is an in-depth analysis detailing your home's value as well as a comparison with similar homes in the area
Home Values in the Area
Average Home Value in this Area
Purchase History
| Date | Buyer | Sale Price | Title Company |
|---|---|---|---|
| Jones Nancy Darlene Daughtery | -- | None Available | |
| Jones Norwood G | $136,500 | None Available | |
| Langdon Joshua Isaac | -- | None Available | |
| Langdon Joshua I | $88,000 | None Available | |
| Langdon George Mack | -- | None Available |
Source: Public Records
Mortgage History
| Date | Status | Borrower | Loan Amount |
|---|---|---|---|
| Previous Owner | Langdon Joshua I | $70,400 |
Source: Public Records
Tax History
| Year | Tax Paid | Tax Assessment Tax Assessment Total Assessment is a certain percentage of the fair market value that is determined by local assessors to be the total taxable value of land and additions on the property. | Land | Improvement |
|---|---|---|---|---|
| 2025 | $1,980 | $204,120 | $80,000 | $124,120 |
| 2024 | $1,475 | $118,960 | $60,000 | $58,960 |
| 2023 | $1,499 | $118,960 | $60,000 | $58,960 |
| 2022 | $1,546 | $118,960 | $60,000 | $58,960 |
| 2021 | $1,546 | $118,960 | $60,000 | $58,960 |
| 2020 | $1,582 | $118,960 | $60,000 | $58,960 |
| 2019 | $1,582 | $118,960 | $60,000 | $58,960 |
| 2018 | $1,274 | $94,370 | $40,560 | $53,810 |
| 2017 | $1,274 | $94,370 | $40,560 | $53,810 |
| 2016 | $1,274 | $94,370 | $40,560 | $53,810 |
| 2015 | $1,274 | $94,370 | $40,560 | $53,810 |
| 2014 | $1,274 | $94,370 | $40,560 | $53,810 |
Source: Public Records
Map
Nearby Homes
- 1007 S 2nd St
- 1011 S 2nd St
- 1010 S Brightleaf Blvd
- 1003 S 2nd St
- 1003 S 2nd St
- 1012 S Brightleaf Blvd
- 1101 S 2nd St
- 1010 S 2nd St
- 1012 S 2nd St
- 1006 S 2nd St
- 1001 S 2nd St
- 1004 S Brightleaf Blvd
- 1004 S 2nd St
- 1102 S 2nd St
- 1103 S 2nd St
- 1104 S Brightleaf Blvd
- 112 E Sanders St
- 917 S 2nd St
- 1106 S 2nd St
- 1105 S 2nd St
Your Personal Tour Guide
Ask me questions while you tour the home.