Estimated Value: $81,000 - $151,000
3
Beds
1
Bath
1,044
Sq Ft
$111/Sq Ft
Est. Value
About This Home
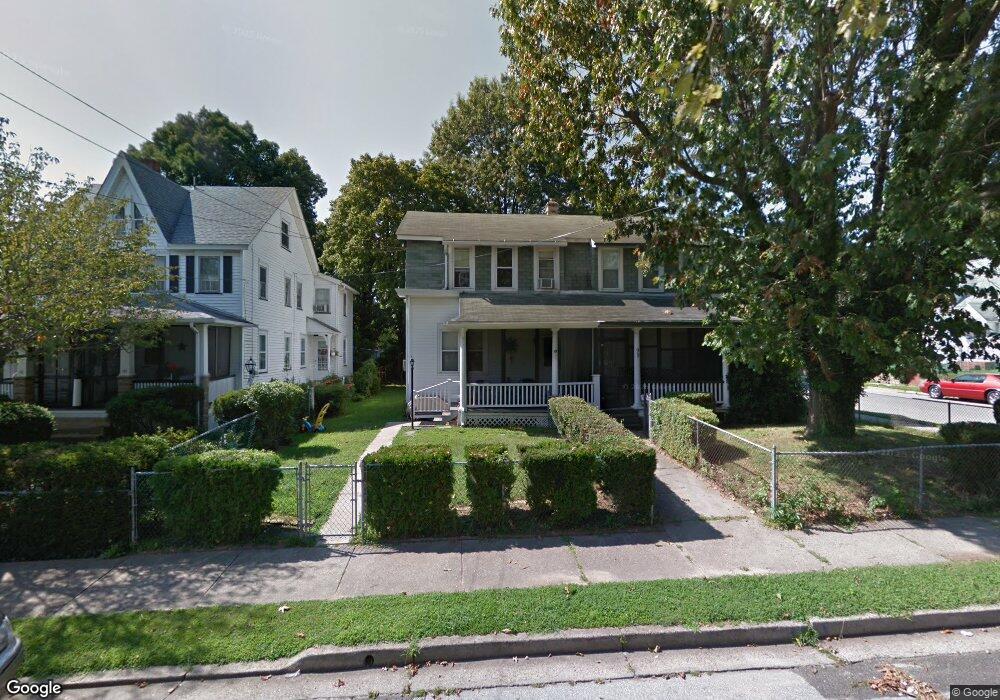
This home is located at 101 8th St, Salem, NJ 08079 and is currently estimated at $115,905, approximately $111 per square foot. 101 8th St is a home located in Salem County with nearby schools including John Fenwick Elementary School, Salem Middle School, and Salem High School.
Ownership History
Date
Name
Owned For
Owner Type
Purchase Details
Closed on
Nov 5, 2010
Sold by
Salinas Ambrosio and Salinas Amelia
Bought by
Layton Robert E and Layton Cindy J
Current Estimated Value
Purchase Details
Closed on
Aug 5, 2009
Sold by
Vanaman Amelia and Salinas Amelia
Bought by
Salinas Ambrosio and Salinas Amelia
Purchase Details
Closed on
Jul 14, 1999
Sold by
Helmbrecht Robert L
Bought by
Vanaman Amelia
Home Financials for this Owner
Home Financials are based on the most recent Mortgage that was taken out on this home.
Original Mortgage
$40,388
Interest Rate
7.39%
Create a Home Valuation Report for This Property
The Home Valuation Report is an in-depth analysis detailing your home's value as well as a comparison with similar homes in the area
Home Values in the Area
Average Home Value in this Area
Purchase History
| Date | Buyer | Sale Price | Title Company |
|---|---|---|---|
| Layton Robert E | $35,000 | -- | |
| Salinas Ambrosio | -- | -- | |
| Vanaman Amelia | $40,000 | Intercoastal Title Agency In |
Source: Public Records
Mortgage History
| Date | Status | Borrower | Loan Amount |
|---|---|---|---|
| Previous Owner | Vanaman Amelia | $40,388 |
Source: Public Records
Tax History
| Year | Tax Paid | Tax Assessment Tax Assessment Total Assessment is a certain percentage of the fair market value that is determined by local assessors to be the total taxable value of land and additions on the property. | Land | Improvement |
|---|---|---|---|---|
| 2025 | $2,458 | $29,900 | $8,500 | $21,400 |
| 2024 | $2,350 | $29,900 | $8,500 | $21,400 |
| 2023 | $2,350 | $29,900 | $8,500 | $21,400 |
| 2022 | $2,248 | $29,900 | $8,500 | $21,400 |
| 2021 | $2,170 | $29,900 | $8,500 | $21,400 |
| 2020 | $2,126 | $29,900 | $8,500 | $21,400 |
| 2019 | $2,114 | $29,900 | $8,500 | $21,400 |
| 2018 | $2,067 | $29,900 | $8,500 | $21,400 |
| 2017 | $2,042 | $29,900 | $8,500 | $21,400 |
| 2016 | $2,526 | $64,500 | $14,400 | $50,100 |
| 2015 | $2,494 | $64,500 | $14,400 | $50,100 |
| 2014 | $2,481 | $64,500 | $14,400 | $50,100 |
Source: Public Records
Map
Nearby Homes
Your Personal Tour Guide
Ask me questions while you tour the home.