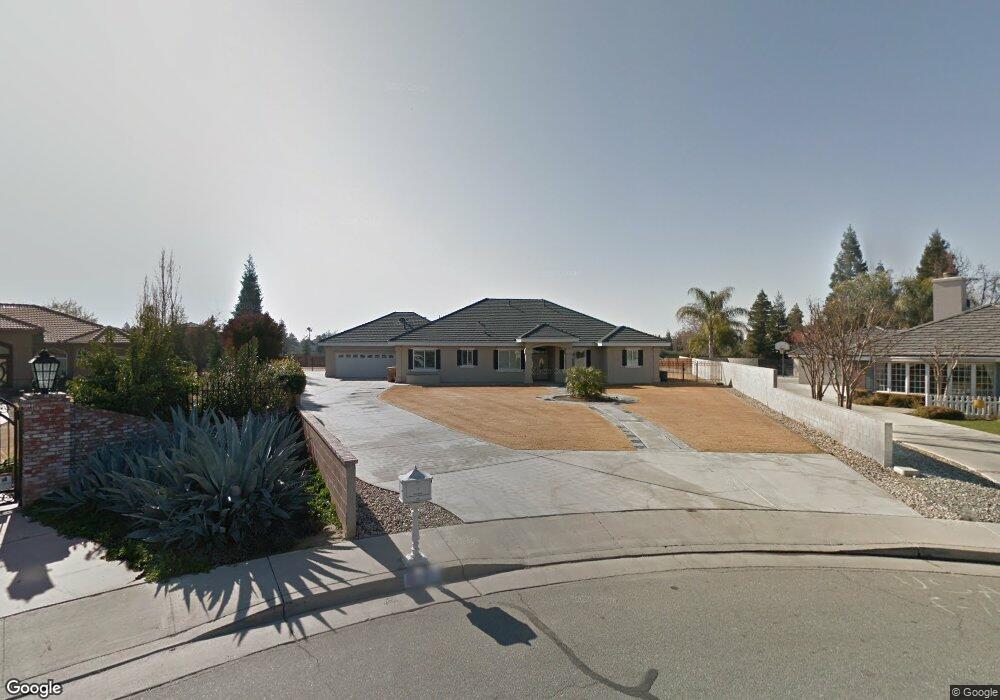
101 Capistrano Ct Bakersfield, CA 93314
Estimated Value: $707,000 - $799,000
3
Beds
2
Baths
3,162
Sq Ft
$237/Sq Ft
Est. Value
About This Home
This home is located at 101 Capistrano Ct, Bakersfield, CA 93314 and is currently estimated at $748,504, approximately $236 per square foot. 101 Capistrano Ct is a home located in Kern County with nearby schools including Del Rio Elementary School, Rosedale Middle School, and Liberty High School.
Ownership History
Date
Name
Owned For
Owner Type
Purchase Details
Closed on
May 9, 2023
Sold by
Roach Dwayne and Roach Patricia L
Bought by
Dwayne And Patricia Roach Family Trust
Current Estimated Value
Purchase Details
Closed on
Jan 25, 2022
Sold by
Villa Del Sol Partners Llc
Bought by
Gallardo Noe and De Gallard Griselda
Home Financials for this Owner
Home Financials are based on the most recent Mortgage that was taken out on this home.
Original Mortgage
$287,950
Interest Rate
3.56%
Mortgage Type
Construction
Purchase Details
Closed on
Aug 4, 2010
Sold by
Noonchester Lynn and Noonchester Gloria
Bought by
Roach Dwayne and Roach Patricia L
Purchase Details
Closed on
May 16, 2002
Sold by
Thomason Construction Inc
Bought by
Noonchester Lynn and Noonchester Gloria
Create a Home Valuation Report for This Property
The Home Valuation Report is an in-depth analysis detailing your home's value as well as a comparison with similar homes in the area
Home Values in the Area
Average Home Value in this Area
Purchase History
| Date | Buyer | Sale Price | Title Company |
|---|---|---|---|
| Dwayne And Patricia Roach Family Trust | -- | None Listed On Document | |
| Gallardo Noe | $288,000 | Chicago Title | |
| Roach Dwayne | $68,500 | Chicago Title Company | |
| Noonchester Lynn | $95,000 | American Title Co |
Source: Public Records
Mortgage History
| Date | Status | Borrower | Loan Amount |
|---|---|---|---|
| Previous Owner | Gallardo Noe | $287,950 |
Source: Public Records
Tax History Compared to Growth
Tax History
| Year | Tax Paid | Tax Assessment Tax Assessment Total Assessment is a certain percentage of the fair market value that is determined by local assessors to be the total taxable value of land and additions on the property. | Land | Improvement |
|---|---|---|---|---|
| 2025 | $6,775 | $565,990 | $160,142 | $405,848 |
| 2024 | $6,775 | $534,716 | $157,002 | $377,714 |
| 2023 | $6,387 | $503,644 | $153,924 | $349,720 |
| 2022 | $6,266 | $493,769 | $150,906 | $342,863 |
| 2021 | $6,091 | $484,089 | $147,948 | $336,141 |
| 2020 | $5,970 | $479,126 | $146,431 | $332,695 |
| 2019 | $5,840 | $479,126 | $146,431 | $332,695 |
| 2018 | $5,688 | $460,523 | $140,746 | $319,777 |
| 2017 | $5,575 | $451,494 | $137,987 | $313,507 |
| 2016 | $5,218 | $442,642 | $135,282 | $307,360 |
| 2015 | $5,115 | $435,994 | $133,250 | $302,744 |
| 2014 | $5,003 | $427,454 | $130,640 | $296,814 |
Source: Public Records
Map
Nearby Homes
- 201 El Paso Rd
- 15829 Cole Brook Ct
- 13506 Morocco Ave
- 501 Reed St
- 12512 Cheswolde Dr
- 12608 Fallstaff Ln
- 306 Portola Ct
- 13904 Las Entradas
- 13408 Frenchglen Ave
- 307 Coachman Way
- 13301 Birkenfeld Ave
- 12217 French Park Ln
- 13900 San Lazaro Ave
- 14008 Las Entradas
- 14016 Las Entradas
- 601 Las Arenas Ct
- 14004 San Lazaro Ave
- 12307 Fairburn Way
- 304 Calle Lechuga
- 100 Capistrano Ct
- 105 Capistrano Ct
- 109 Capistrano Ct
- 104 Cortez Ct
- 108 Capistrano Ct
- 113 Capistrano Ct
- 108 Cortez Ct
- 112 Capistrano Ct
- 100 Cortez Ct
- 100 Joelyle St
- 117 Capistrano Ct
- 112 Cortez Ct
- 116 Capistrano Ct
- 13200 Seann Ct
- 104 Joelyle St
- 13204 Seann Ct
- 101 Cortez Ct
- 116 Cortez Ct
- 13004 Stockdale Hwy
- 12913 San Juan Ave