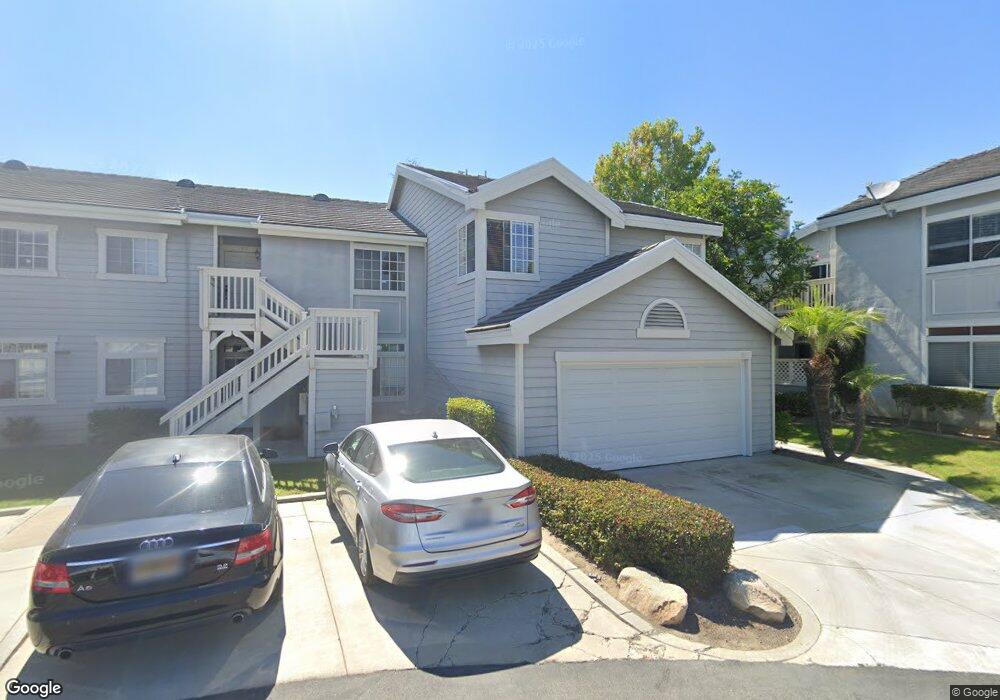
101 Dover Place Laguna Niguel, CA 92677
Beacon Hill NeighborhoodEstimated Value: $947,000 - $1,064,000
3
Beds
3
Baths
1,414
Sq Ft
$704/Sq Ft
Est. Value
About This Home
This home is located at 101 Dover Place, Laguna Niguel, CA 92677 and is currently estimated at $994,758, approximately $703 per square foot. 101 Dover Place is a home located in Orange County with nearby schools including John Malcom Elementary School, Niguel Hills Middle School, and Dana Hills High School.
Ownership History
Date
Name
Owned For
Owner Type
Purchase Details
Closed on
Jul 20, 1998
Sold by
Geers Bayers Mari
Bought by
Obrien Charles and Obrien Dawn
Current Estimated Value
Home Financials for this Owner
Home Financials are based on the most recent Mortgage that was taken out on this home.
Original Mortgage
$174,400
Outstanding Balance
$35,318
Interest Rate
6.88%
Estimated Equity
$959,440
Purchase Details
Closed on
Mar 18, 1994
Sold by
Quarenghi Charles Raymond
Bought by
Bayers Mari Geers
Home Financials for this Owner
Home Financials are based on the most recent Mortgage that was taken out on this home.
Original Mortgage
$132,700
Interest Rate
3.75%
Purchase Details
Closed on
Mar 16, 1994
Sold by
Scott Arthur G
Bought by
Bayers Mari Geers
Home Financials for this Owner
Home Financials are based on the most recent Mortgage that was taken out on this home.
Original Mortgage
$132,700
Interest Rate
3.75%
Create a Home Valuation Report for This Property
The Home Valuation Report is an in-depth analysis detailing your home's value as well as a comparison with similar homes in the area
Home Values in the Area
Average Home Value in this Area
Purchase History
| Date | Buyer | Sale Price | Title Company |
|---|---|---|---|
| Obrien Charles | $218,000 | Lawyers Title Company | |
| Bayers Mari Geers | -- | Continental Lawyers Title Co | |
| Bayers Mari Geers | $166,000 | Continental Lawyers Title Co |
Source: Public Records
Mortgage History
| Date | Status | Borrower | Loan Amount |
|---|---|---|---|
| Open | Obrien Charles | $174,400 | |
| Previous Owner | Bayers Mari Geers | $132,700 |
Source: Public Records
Tax History Compared to Growth
Tax History
| Year | Tax Paid | Tax Assessment Tax Assessment Total Assessment is a certain percentage of the fair market value that is determined by local assessors to be the total taxable value of land and additions on the property. | Land | Improvement |
|---|---|---|---|---|
| 2025 | $3,334 | $341,749 | $188,589 | $153,160 |
| 2024 | $3,334 | $335,049 | $184,892 | $150,157 |
| 2023 | $3,262 | $328,480 | $181,267 | $147,213 |
| 2022 | $3,199 | $322,040 | $177,713 | $144,327 |
| 2021 | $3,136 | $315,726 | $174,228 | $141,498 |
| 2020 | $3,104 | $312,489 | $172,441 | $140,048 |
| 2019 | $3,094 | $306,362 | $169,060 | $137,302 |
| 2018 | $3,092 | $300,355 | $165,745 | $134,610 |
| 2017 | $3,007 | $294,466 | $162,495 | $131,971 |
| 2016 | $3,015 | $288,693 | $159,309 | $129,384 |
| 2015 | $2,919 | $284,357 | $156,916 | $127,441 |
| 2014 | $2,873 | $278,787 | $153,842 | $124,945 |
Source: Public Records
Map
Nearby Homes
- 2 High Bluff
- 11 High Bluff
- 21 Campton Place
- 31 White Sail
- 1 Pacifico
- 24 Costa Brava
- 32391 Barkentine Blvd
- 23966 Wanigan Way
- 226 Shorebreaker Dr
- 94 Shorebreaker Dr
- 22 Terrace Cir
- 32395 Outrigger Way Unit 22
- 37 Terrace Cir
- 9 Pembroke Ln
- 5 Ebony Glade
- 24 Bright Water Dr
- 1 Moss Landing
- 16 Corniche Dr Unit A
- 55 S Peak
- 37 Santa Lucia
- 103 Dover Place Unit 103
- 105 Dover Place Unit 105
- 93 Dover Place
- 107 Dover Place
- 89 Dover Place Unit 89
- 97 Dover Place Unit 97
- 109 Dover Place Unit 109
- 91 Dover Place
- 111 Dover Place
- 87 Dover Place Unit 87
- 95 Dover Place Unit 95
- 113 Dover Place Unit 113
- 85 Dover Place Unit 85
- 115 Dover Place
- 99 Dover Place
- 83 Dover Place
- 117 Dover Place
- 79 Dover Place
- 81 Dover Place Unit 81
- 119 Dover Place Unit 119