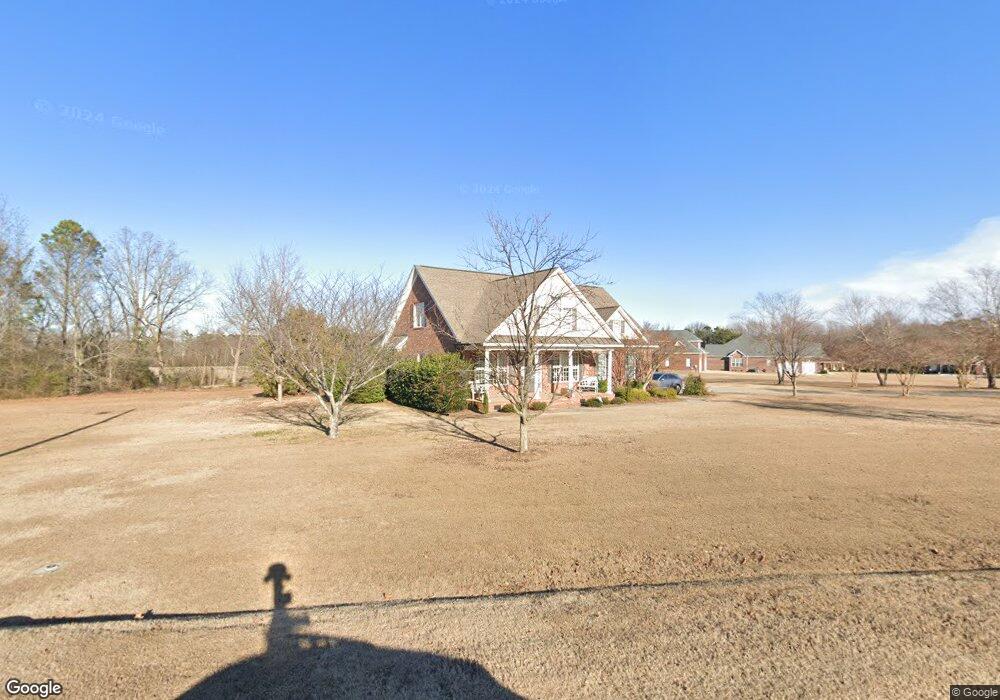
101 E Stoneybrook Ct Benson, NC 27504
Estimated Value: $532,163 - $614,000
3
Beds
3
Baths
3,523
Sq Ft
$162/Sq Ft
Est. Value
About This Home
This home is located at 101 E Stoneybrook Ct, Benson, NC 27504 and is currently estimated at $571,041, approximately $162 per square foot. 101 E Stoneybrook Ct is a home located in Johnston County with nearby schools including Benson Elementary School, Benson Middle School, and South Johnston High School.
Ownership History
Date
Name
Owned For
Owner Type
Purchase Details
Closed on
Mar 28, 2017
Sold by
Graham John Alwin and Graham Anne R
Bought by
Hernandez Matilde and Hernandez Susan Stephenson
Current Estimated Value
Home Financials for this Owner
Home Financials are based on the most recent Mortgage that was taken out on this home.
Original Mortgage
$264,000
Outstanding Balance
$219,447
Interest Rate
4.17%
Mortgage Type
New Conventional
Estimated Equity
$351,594
Purchase Details
Closed on
Nov 20, 2006
Sold by
Burnette William A and Burnette Sharon B
Bought by
Graham John Alwin and Graham Anne R
Purchase Details
Closed on
Mar 10, 2006
Sold by
Lee James Franklin
Bought by
Burnette William A and Burnette Sharon B
Purchase Details
Closed on
Nov 9, 2001
Sold by
Lee James Franklin Rev Trst
Bought by
Lee James Franklin
Create a Home Valuation Report for This Property
The Home Valuation Report is an in-depth analysis detailing your home's value as well as a comparison with similar homes in the area
Home Values in the Area
Average Home Value in this Area
Purchase History
| Date | Buyer | Sale Price | Title Company |
|---|---|---|---|
| Hernandez Matilde | $330,000 | -- | |
| Graham John Alwin | $44,000 | None Available | |
| Burnette William A | $40,000 | None Available | |
| Lee James Franklin | -- | -- |
Source: Public Records
Mortgage History
| Date | Status | Borrower | Loan Amount |
|---|---|---|---|
| Open | Hernandez Matilde | $264,000 |
Source: Public Records
Tax History
| Year | Tax Paid | Tax Assessment Tax Assessment Total Assessment is a certain percentage of the fair market value that is determined by local assessors to be the total taxable value of land and additions on the property. | Land | Improvement |
|---|---|---|---|---|
| 2025 | $646 | $572,020 | $81,550 | $490,470 |
| 2024 | $4,119 | $321,800 | $41,250 | $280,550 |
| 2023 | $4,119 | $321,800 | $41,250 | $280,550 |
| 2022 | $4,119 | $321,800 | $41,250 | $280,550 |
| 2021 | $4,119 | $321,800 | $41,250 | $280,550 |
| 2020 | $4,151 | $321,800 | $41,250 | $280,550 |
| 2019 | $4,151 | $321,800 | $41,250 | $280,550 |
| 2018 | $4,279 | $324,190 | $36,460 | $287,730 |
| 2017 | $4,522 | $324,190 | $36,460 | $287,730 |
| 2016 | $4,534 | $324,190 | $36,460 | $287,730 |
| 2015 | $4,144 | $316,370 | $36,460 | $279,910 |
| 2014 | $4,144 | $316,370 | $36,460 | $279,910 |
Source: Public Records
Map
Nearby Homes
- 1039 N Lincoln St
- Tract 3 Benson Hardee Rd
- Tract 1 Benson Hardee Rd
- Tract 2 Benson Hardee Rd
- 802 N Lincoln St
- 704 N Lincoln St
- 0 Benson Hardee Rd Unit 10069689
- 15 Denning Farms Ln
- 416 W Martin St
- 508 W Church St
- 702 W Main St
- 301 W Hill St
- 0 W Church St
- 608 W Parrish Dr
- 111 Tarheel Rd
- 204 W Hill St
- 212 W Church St
- 314 W Main St
- 1120 W Pope St
- 300 S Pine St
- 383 Dogeye Rd
- 202 W Stoneybrook Ct
- 399 Dogeye Rd
- 109 E Stoneybrook Ct
- 316 Dogeye Rd
- 108 E Stoneybrook Ct
- 390 Dogeye Rd
- 201 W Stoneybrook Ct
- 400 Dogeye Rd
- 415 Dogeye Rd
- 112 E Stoneybrook Ct
- 112 E Stoneybrook Ct Unit 31
- 430 Dogeye Rd
- 117 E Stoneybrook Ct
- 116 E Stoneybrook Ct
- 116 E Stoneybrook Ct Unit 30
- 120 E Stoneybrook Ct
- 120 E Stoneybrook Ct Unit 29
- 277 Dogeye Rd
- 4 Dogeye Rd
Your Personal Tour Guide
Ask me questions while you tour the home.