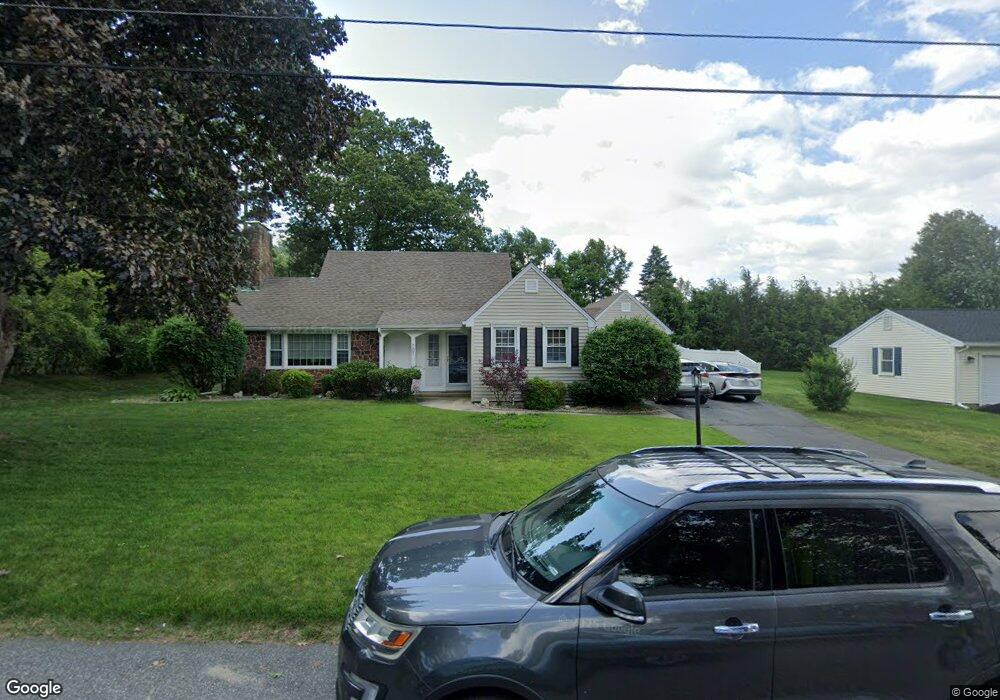
101 Harrow Rd Springfield, MA 01118
Sixteen Acres NeighborhoodEstimated Value: $364,000 - $405,000
3
Beds
2
Baths
1,626
Sq Ft
$232/Sq Ft
Est. Value
About This Home
This home is located at 101 Harrow Rd, Springfield, MA 01118 and is currently estimated at $377,118, approximately $231 per square foot. 101 Harrow Rd is a home located in Hampden County with nearby schools including Arthur T Talmadge Elementary School, M Marcus Kiley Middle, and Springfield High School of Science and Technology.
Ownership History
Date
Name
Owned For
Owner Type
Purchase Details
Closed on
Apr 30, 1997
Sold by
Hellberg Peter G and Hellberg Susan J
Bought by
Woods Derik J and Woods Dazella D
Current Estimated Value
Home Financials for this Owner
Home Financials are based on the most recent Mortgage that was taken out on this home.
Original Mortgage
$115,700
Interest Rate
7.85%
Mortgage Type
Purchase Money Mortgage
Purchase Details
Closed on
Jun 27, 1994
Sold by
Cascio Patricia
Bought by
Hellberg Peter G and Hellberg Susan J
Home Financials for this Owner
Home Financials are based on the most recent Mortgage that was taken out on this home.
Original Mortgage
$107,550
Interest Rate
8.74%
Mortgage Type
Purchase Money Mortgage
Create a Home Valuation Report for This Property
The Home Valuation Report is an in-depth analysis detailing your home's value as well as a comparison with similar homes in the area
Home Values in the Area
Average Home Value in this Area
Purchase History
| Date | Buyer | Sale Price | Title Company |
|---|---|---|---|
| Woods Derik J | $116,400 | -- | |
| Hellberg Peter G | $120,000 | -- |
Source: Public Records
Mortgage History
| Date | Status | Borrower | Loan Amount |
|---|---|---|---|
| Open | Hellberg Peter G | $140,000 | |
| Closed | Hellberg Peter G | $115,500 | |
| Closed | Hellberg Peter G | $115,700 | |
| Previous Owner | Hellberg Peter G | $107,550 |
Source: Public Records
Tax History
| Year | Tax Paid | Tax Assessment Tax Assessment Total Assessment is a certain percentage of the fair market value that is determined by local assessors to be the total taxable value of land and additions on the property. | Land | Improvement |
|---|---|---|---|---|
| 2025 | $6,267 | $399,700 | $61,500 | $338,200 |
| 2024 | $6,271 | $390,500 | $61,500 | $329,000 |
| 2023 | $5,857 | $343,500 | $58,500 | $285,000 |
| 2022 | $5,603 | $297,700 | $61,800 | $235,900 |
| 2021 | $5,247 | $277,600 | $56,200 | $221,400 |
| 2020 | $5,150 | $263,700 | $56,200 | $207,500 |
| 2019 | $5,046 | $256,400 | $56,200 | $200,200 |
| 2018 | $4,963 | $252,200 | $56,200 | $196,000 |
| 2017 | $4,711 | $239,600 | $56,200 | $183,400 |
| 2016 | $4,353 | $221,400 | $56,200 | $165,200 |
| 2015 | $4,381 | $222,700 | $56,200 | $166,500 |
Source: Public Records
Map
Nearby Homes
- 86 Wildwood Ave
- 81 W Crystal Brook Dr
- 24 Wands St
- 120 Bridle Path Rd
- 85 Talmadge Dr
- 41 Hillside Dr
- 86 Talmadge Dr
- 25 Laurelwood Ln
- 55 Old Farm Rd
- 17 Pebble Mill Rd
- 55 Allen St
- 1962 Allen St
- 17 Skyridge Ln
- 101 Regal St
- 647 Plumtree Rd
- 228 Acrebrook Rd
- 19 Manor Ct Unit 19
- 73 Timber Ln
- 46 Puritan Cir
- 744 Bradley Rd
Your Personal Tour Guide
Ask me questions while you tour the home.