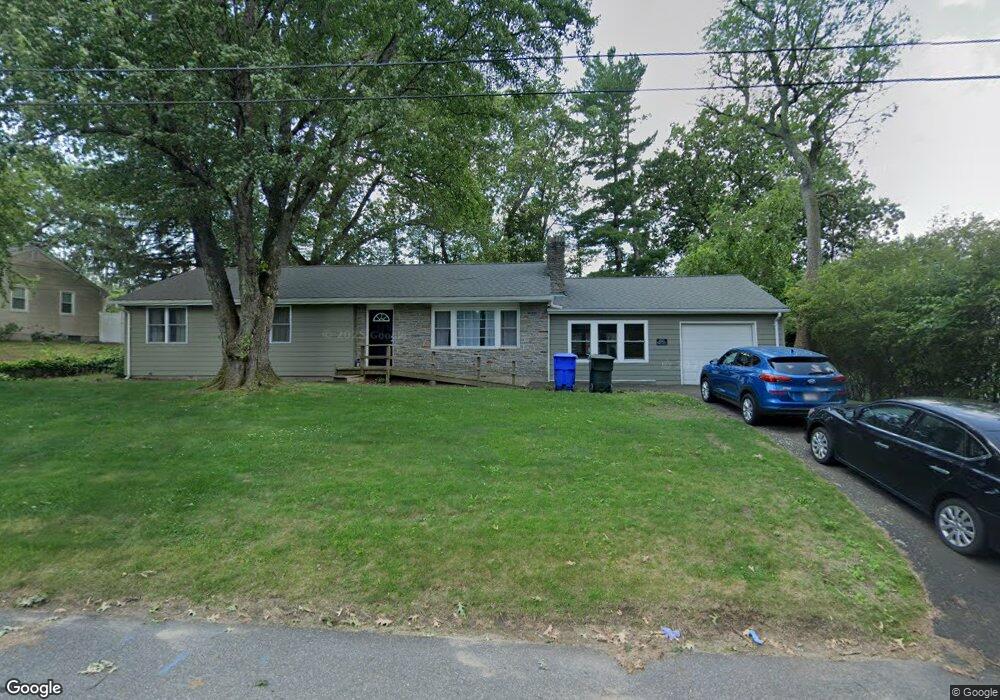
111 Harrow Rd Springfield, MA 01118
Sixteen Acres NeighborhoodEstimated Value: $368,000 - $417,000
About This Home
This home is located at 111 Harrow Rd, Springfield, MA 01118 and is currently estimated at $385,055, approximately $241 per square foot. 111 Harrow Rd is a home located in Hampden County with nearby schools including Arthur T Talmadge Elementary School, M Marcus Kiley Middle, and Springfield High School of Science and Technology.
Ownership History
We collect this data history from publicly available records. To have your information removed, we recommend requesting removal directly through your county’s website.
Purchase Details
Purchase Details
Purchase Details
Home Values in the Area
Average Home Value in this Area
Purchase History
We collect this data history from publicly available records. To have your information removed, we recommend requesting removal directly through your county’s website.
| Date | Buyer | Sale Price | Title Company |
|---|---|---|---|
| -- | -- | ||
| $177,000 | -- | ||
| $148,900 | -- |
Tax History
We collect this data history from publicly available records. To have your information removed, we recommend requesting removal directly through your county’s website.
| Year | Tax Paid | Tax Assessment Tax Assessment Total Assessment is a certain percentage of the fair market value that is determined by local assessors to be the total taxable value of land and additions on the property. | Land | Improvement |
|---|---|---|---|---|
| 2025 | $5,516 | $351,800 | $61,600 | $290,200 |
| 2024 | $5,501 | $342,500 | $61,600 | $280,900 |
| 2023 | $4,900 | $287,400 | $58,600 | $228,800 |
| 2022 | $4,592 | $244,000 | $61,800 | $182,200 |
| 2021 | $4,364 | $230,900 | $56,200 | $174,700 |
| 2020 | $4,236 | $216,900 | $56,200 | $160,700 |
| 2019 | $4,123 | $209,500 | $56,200 | $153,300 |
| 2018 | $4,028 | $204,700 | $56,200 | $148,500 |
| 2017 | $3,836 | $195,100 | $56,200 | $138,900 |
| 2016 | $3,678 | $187,100 | $56,200 | $130,900 |
| 2015 | $3,720 | $189,100 | $56,200 | $132,900 |
Map
- 68 Deepfield Rd
- 87 Squire Ln
- 87 Bridle Path Rd
- 55 Bridle Path Rd
- 43 Pine Hill Rd
- 31 Acrebrook Rd
- 46 Rochford Cir
- 51 Briarcliff St
- 64 Rochford Cir
- 39 Bartels St
- 21 Ryan Cir
- 915 Bradley Rd
- 65 Brookside Cir
- 647 Plumtree Rd
- 43 Sunridge Dr
- 83 Druid Hill Rd
- 346 Newhouse St
- 20 Fallston St
- 11 Butternut St
- 97 Treetop Ave
Ask me questions while you tour the home.