Estimated Value: $88,000 - $160,000
3
Beds
2
Baths
1,528
Sq Ft
$79/Sq Ft
Est. Value
About This Home
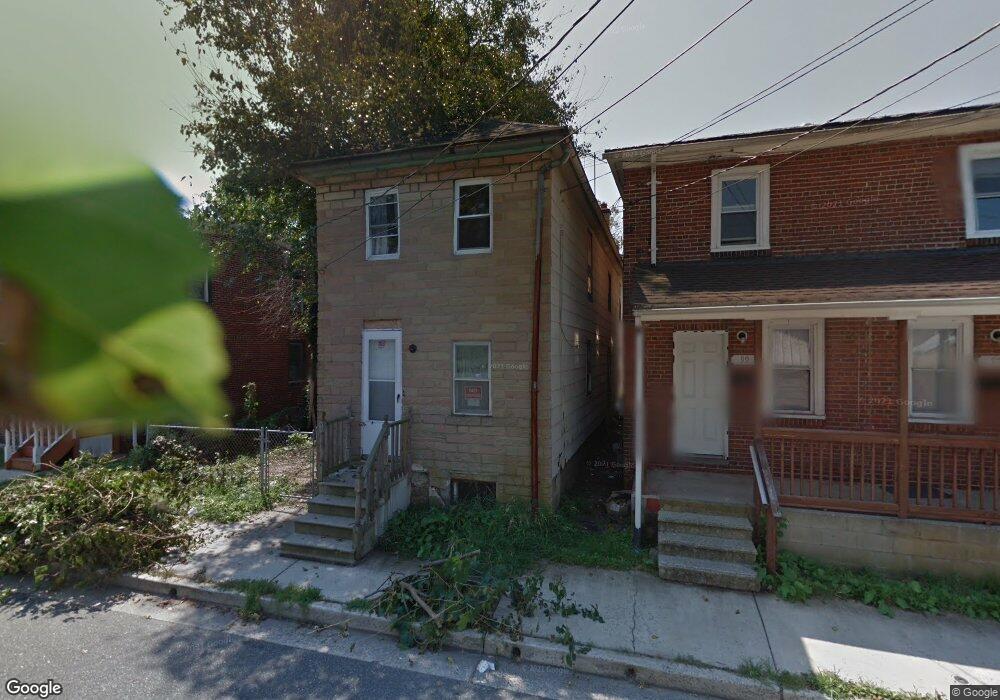
This home is located at 101 Hedge St, Salem, NJ 08079 and is currently estimated at $120,953, approximately $79 per square foot. 101 Hedge St is a home located in Salem County with nearby schools including John Fenwick Elementary School, Salem Middle School, and Salem High School.
Ownership History
Date
Name
Owned For
Owner Type
Purchase Details
Closed on
Mar 29, 2023
Sold by
Jones Michaek
Bought by
Bennett Vincent
Current Estimated Value
Purchase Details
Closed on
May 25, 2016
Sold by
Haddad Victoria
Bought by
Jones Michael Aron
Purchase Details
Closed on
Mar 27, 2015
Sold by
Bleiman Jack
Bought by
Haddad Victoria
Purchase Details
Closed on
Aug 5, 2005
Sold by
Bleiman Jack
Bought by
Bleiman Jack
Create a Home Valuation Report for This Property
The Home Valuation Report is an in-depth analysis detailing your home's value as well as a comparison with similar homes in the area
Home Values in the Area
Average Home Value in this Area
Purchase History
| Date | Buyer | Sale Price | Title Company |
|---|---|---|---|
| Bennett Vincent | -- | -- | |
| Bennett Vincent | -- | None Listed On Document | |
| Jones Michael Aron | -- | None Available | |
| Haddad Victoria | -- | Salem Oak Title Agency | |
| Bleiman Jack | -- | -- |
Source: Public Records
Tax History Compared to Growth
Tax History
| Year | Tax Paid | Tax Assessment Tax Assessment Total Assessment is a certain percentage of the fair market value that is determined by local assessors to be the total taxable value of land and additions on the property. | Land | Improvement |
|---|---|---|---|---|
| 2025 | $2,968 | $36,100 | $7,600 | $28,500 |
| 2024 | $2,838 | $36,100 | $7,600 | $28,500 |
| 2023 | $2,838 | $36,100 | $7,600 | $28,500 |
| 2022 | $2,714 | $36,100 | $7,600 | $28,500 |
| 2021 | $2,620 | $36,100 | $7,600 | $28,500 |
| 2020 | $2,567 | $36,100 | $7,600 | $28,500 |
| 2019 | $2,552 | $36,100 | $7,600 | $28,500 |
| 2018 | $2,496 | $36,100 | $7,600 | $28,500 |
| 2017 | $2,466 | $36,100 | $7,600 | $28,500 |
| 2016 | $1,371 | $35,000 | $16,100 | $18,900 |
| 2015 | $1,353 | $35,000 | $16,100 | $18,900 |
| 2014 | -- | $53,400 | $16,100 | $37,300 |
Source: Public Records
Map
Nearby Homes