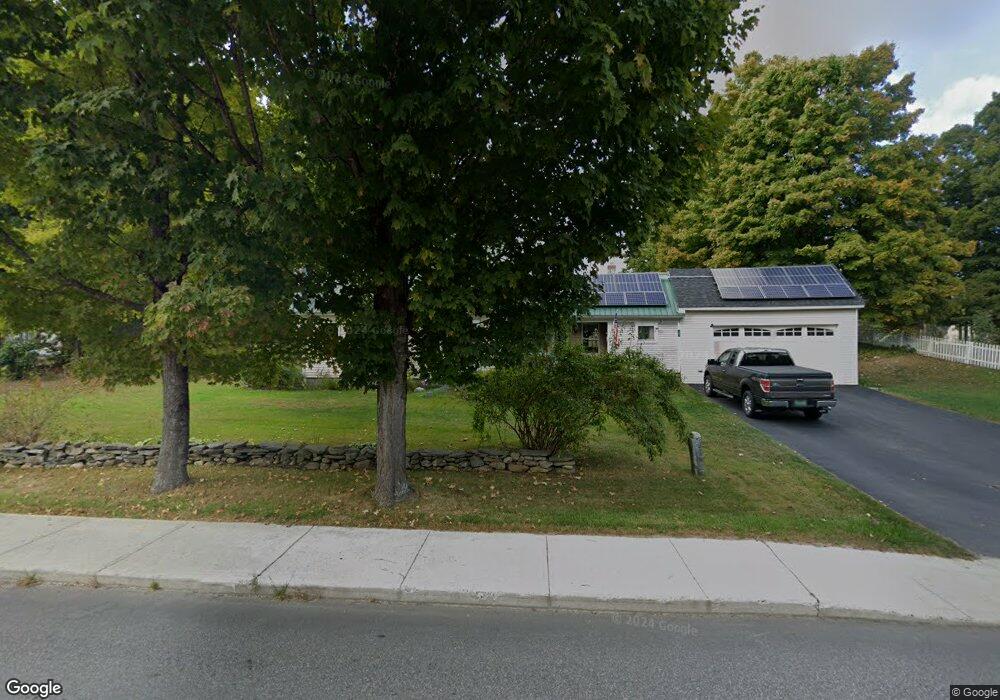
101 Main St North Springfield, VT 05150
Estimated Value: $141,000 - $206,000
1
Bed
1
Bath
1,247
Sq Ft
$144/Sq Ft
Est. Value
About This Home
This home is located at 101 Main St, North Springfield, VT 05150 and is currently estimated at $180,066, approximately $144 per square foot. 101 Main St is a home located in Windsor County with nearby schools including Elm Hill School, Union Street School, and Riverside School.
Ownership History
Date
Name
Owned For
Owner Type
Purchase Details
Closed on
Aug 20, 2025
Sold by
Losavio Fred and Losavio Betty M
Bought by
Losee Justin
Current Estimated Value
Purchase Details
Closed on
Jan 21, 2004
Sold by
Losee Betty M
Bought by
Losee Betty M and Losavio Fred
Purchase Details
Closed on
Sep 26, 1996
Sold by
Brattleboro Savings & Loan
Bought by
Losee Leland J and Losee Betty M
Purchase Details
Closed on
Sep 22, 1994
Sold by
Lefevre Muriel E
Bought by
Springfield Savings & Loan Assoc
Purchase Details
Closed on
Oct 30, 1990
Sold by
Macey Robert G and Macey Wanita C
Bought by
Lefevre Muriel E
Create a Home Valuation Report for This Property
The Home Valuation Report is an in-depth analysis detailing your home's value as well as a comparison with similar homes in the area
Home Values in the Area
Average Home Value in this Area
Purchase History
| Date | Buyer | Sale Price | Title Company |
|---|---|---|---|
| Losee Justin | -- | -- | |
| Losee Betty M | -- | -- | |
| Losee Betty M | -- | -- | |
| Losee Leland J | $35,000 | -- | |
| Losee Leland J | $35,000 | -- | |
| Springfield Savings & Loan Assoc | -- | -- | |
| Springfield Savings & Loan Assoc | -- | -- | |
| Lefevre Muriel E | $63,000 | -- | |
| Lefevre Muriel E | $63,000 | -- |
Source: Public Records
Tax History
| Year | Tax Paid | Tax Assessment Tax Assessment Total Assessment is a certain percentage of the fair market value that is determined by local assessors to be the total taxable value of land and additions on the property. | Land | Improvement |
|---|---|---|---|---|
| 2024 | $3,767 | $106,500 | $22,100 | $84,400 |
| 2023 | $1,545 | $106,500 | $22,100 | $84,400 |
| 2022 | $3,419 | $106,500 | $22,100 | $84,400 |
| 2021 | $3,493 | $93,500 | $15,500 | $78,000 |
| 2020 | $3,554 | $93,500 | $15,500 | $78,000 |
| 2019 | $3,456 | $93,800 | $15,500 | $78,300 |
| 2018 | $3,431 | $93,800 | $15,500 | $78,300 |
| 2016 | $2,911 | $95,800 | $22,000 | $73,800 |
Source: Public Records
Map
Nearby Homes
Your Personal Tour Guide
Ask me questions while you tour the home.