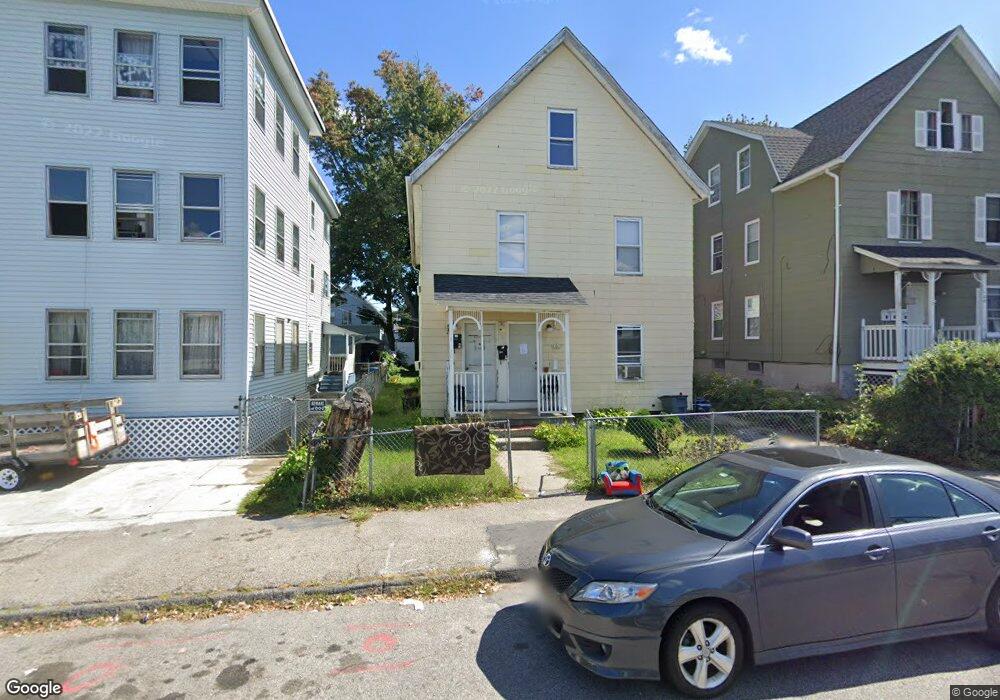
101 Mayfield St Worcester, MA 01602
Columbus Park NeighborhoodEstimated Value: $378,133 - $568,000
5
Beds
2
Baths
2,070
Sq Ft
$238/Sq Ft
Est. Value
About This Home
This home is located at 101 Mayfield St, Worcester, MA 01602 and is currently estimated at $493,283, approximately $238 per square foot. 101 Mayfield St is a home located in Worcester County with nearby schools including Jacob Hiatt Magnet School, Chandler Magnet, and May Street Elementary School.
Ownership History
Date
Name
Owned For
Owner Type
Purchase Details
Closed on
Oct 18, 2002
Sold by
Cruz Rafael
Bought by
Whaley-Chame Tina M
Current Estimated Value
Home Financials for this Owner
Home Financials are based on the most recent Mortgage that was taken out on this home.
Original Mortgage
$150,636
Outstanding Balance
$63,245
Interest Rate
6.18%
Mortgage Type
Purchase Money Mortgage
Estimated Equity
$430,038
Purchase Details
Closed on
Mar 14, 2002
Sold by
Mundo Santos and Mundo-Lopez Santos
Bought by
Cruz Rafael
Home Financials for this Owner
Home Financials are based on the most recent Mortgage that was taken out on this home.
Original Mortgage
$137,700
Interest Rate
7.04%
Mortgage Type
Purchase Money Mortgage
Purchase Details
Closed on
Nov 9, 1990
Sold by
Ferguson Mark
Bought by
Mundo Santos
Home Financials for this Owner
Home Financials are based on the most recent Mortgage that was taken out on this home.
Original Mortgage
$16,000
Interest Rate
10.19%
Purchase Details
Closed on
Feb 23, 1990
Sold by
Rutherford J Ernest
Bought by
Ferguson Mark
Create a Home Valuation Report for This Property
The Home Valuation Report is an in-depth analysis detailing your home's value as well as a comparison with similar homes in the area
Home Values in the Area
Average Home Value in this Area
Purchase History
| Date | Buyer | Sale Price | Title Company |
|---|---|---|---|
| Whaley-Chame Tina M | $153,000 | -- | |
| Cruz Rafael | $140,000 | -- | |
| Mundo Santos | $60,000 | -- | |
| Ferguson Mark | $1,000 | -- |
Source: Public Records
Mortgage History
| Date | Status | Borrower | Loan Amount |
|---|---|---|---|
| Open | Ferguson Mark | $150,636 | |
| Previous Owner | Ferguson Mark | $137,700 | |
| Previous Owner | Ferguson Mark | $16,000 | |
| Previous Owner | Ferguson Mark | $83,987 |
Source: Public Records
Tax History
| Year | Tax Paid | Tax Assessment Tax Assessment Total Assessment is a certain percentage of the fair market value that is determined by local assessors to be the total taxable value of land and additions on the property. | Land | Improvement |
|---|---|---|---|---|
| 2025 | $3,920 | $297,200 | $69,600 | $227,600 |
| 2024 | $3,755 | $273,100 | $69,600 | $203,500 |
| 2023 | $3,506 | $244,500 | $60,500 | $184,000 |
| 2022 | $3,378 | $222,100 | $48,400 | $173,700 |
| 2021 | $2,961 | $181,900 | $38,700 | $143,200 |
| 2020 | $2,769 | $162,900 | $38,400 | $124,500 |
| 2019 | $2,839 | $157,700 | $33,600 | $124,100 |
| 2018 | $2,772 | $146,600 | $33,600 | $113,000 |
| 2017 | $2,622 | $136,400 | $33,600 | $102,800 |
| 2016 | $2,582 | $125,300 | $24,800 | $100,500 |
| 2015 | $2,515 | $125,300 | $24,800 | $100,500 |
| 2014 | $2,448 | $125,300 | $24,800 | $100,500 |
Source: Public Records
Map
Nearby Homes
- 105 Mayfield St
- 97 Mayfield St
- 97 Mayfield St Unit 3
- 97 Mayfield St Unit 2
- 111 Mayfield St
- 95 Mayfield St
- 93 Mayfield St
- 106 Winfield St
- 104 Winfield St
- 110 Winfield St
- 89 Mayfield St
- 100 Winfield St
- 114 Winfield St Unit first
- 114 Winfield St Unit 1
- 114 Winfield St
- 114 Winfield St Unit 3
- 114 Winfield St Unit 2
- 94 Winfield St
- 85 Mayfield St
- 112 Winfield St
Your Personal Tour Guide
Ask me questions while you tour the home.