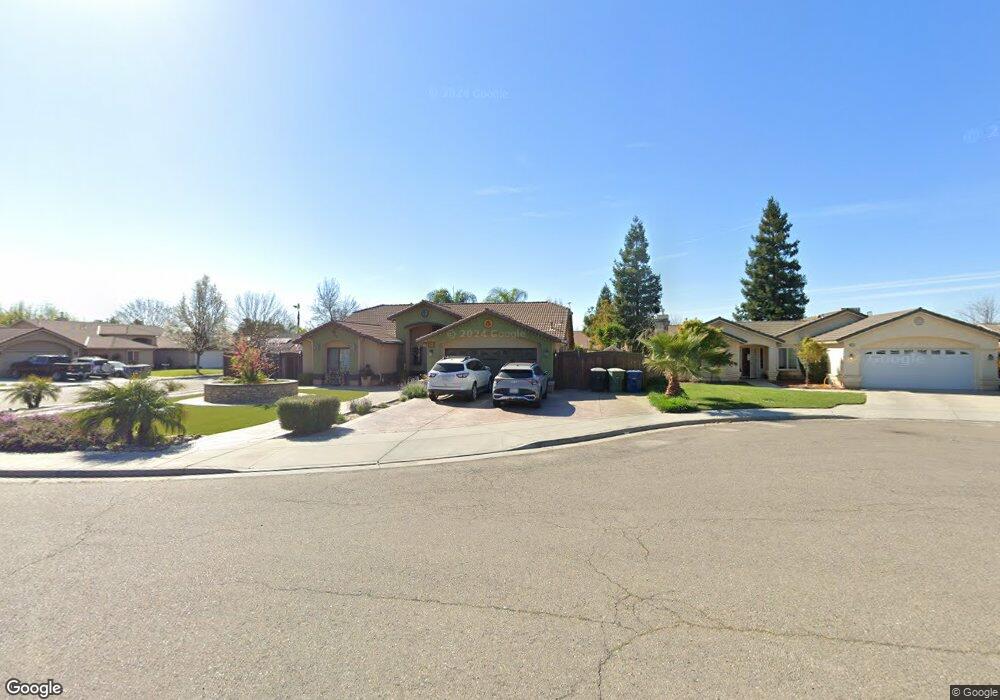
101 Phillip Ct Chowchilla, CA 93610
Estimated Value: $408,000 - $451,000
3
Beds
2
Baths
1,875
Sq Ft
$225/Sq Ft
Est. Value
About This Home
This home is located at 101 Phillip Ct, Chowchilla, CA 93610 and is currently estimated at $421,073, approximately $224 per square foot. 101 Phillip Ct is a home located in Madera County with nearby schools including Merle L. Fuller Elementary School, Stephens Elementary School, and Ronald Reagan Elementary School.
Ownership History
Date
Name
Owned For
Owner Type
Purchase Details
Closed on
May 19, 2014
Sold by
Zalez 9004 Llc
Bought by
Bautista Barragan Ignacio Robles and Bautista Reyes Angelica
Current Estimated Value
Home Financials for this Owner
Home Financials are based on the most recent Mortgage that was taken out on this home.
Original Mortgage
$153,750
Outstanding Balance
$116,736
Interest Rate
4.23%
Mortgage Type
VA
Estimated Equity
$304,337
Purchase Details
Closed on
Jan 21, 2014
Sold by
Falzarano Carmine and Falzarano Genoveva
Bought by
Zalez 9004 Llc
Purchase Details
Closed on
May 14, 2005
Sold by
Dmp Development Corp
Bought by
Falzarano Carmine and Falzarano Genoveva
Home Financials for this Owner
Home Financials are based on the most recent Mortgage that was taken out on this home.
Original Mortgage
$208,830
Interest Rate
5.6%
Mortgage Type
Fannie Mae Freddie Mac
Create a Home Valuation Report for This Property
The Home Valuation Report is an in-depth analysis detailing your home's value as well as a comparison with similar homes in the area
Home Values in the Area
Average Home Value in this Area
Purchase History
| Date | Buyer | Sale Price | Title Company |
|---|---|---|---|
| Bautista Barragan Ignacio Robles | $205,000 | Chicago Title Company | |
| Zalez 9004 Llc | $147,000 | None Available | |
| Falzarano Carmine | $261,500 | First American Title |
Source: Public Records
Mortgage History
| Date | Status | Borrower | Loan Amount |
|---|---|---|---|
| Open | Bautista Barragan Ignacio Robles | $153,750 | |
| Previous Owner | Falzarano Carmine | $208,830 |
Source: Public Records
Tax History
| Year | Tax Paid | Tax Assessment Tax Assessment Total Assessment is a certain percentage of the fair market value that is determined by local assessors to be the total taxable value of land and additions on the property. | Land | Improvement |
|---|---|---|---|---|
| 2025 | $2,691 | $251,291 | $36,771 | $214,520 |
| 2023 | $2,691 | $241,535 | $35,344 | $206,191 |
| 2022 | $2,519 | $236,800 | $34,651 | $202,149 |
| 2021 | $2,483 | $232,158 | $33,972 | $198,186 |
| 2020 | $2,421 | $229,778 | $33,624 | $196,154 |
| 2019 | $2,399 | $225,273 | $32,965 | $192,308 |
| 2018 | $2,346 | $220,857 | $32,319 | $188,538 |
| 2017 | $2,309 | $216,528 | $31,686 | $184,842 |
| 2016 | $2,238 | $212,283 | $31,065 | $181,218 |
| 2015 | $2,211 | $209,095 | $30,599 | $178,496 |
| 2014 | $1,643 | $147,000 | $25,000 | $122,000 |
Source: Public Records
Map
Nearby Homes
- 344 Rose Ave
- 569 Englewood Ave
- 510 Parkridge Dr
- 175 Oleander Dr
- 1604 Parkridge Dr
- 0 Avenue 25
- 1315 Ventura Ave
- 547 Blossom Dr
- 1116 Sonoma Ave
- 1108 Kings Ave
- 904 Riverside Ave
- 808 Ventura Ave
- 1105 Orange Ave
- 801 Riverside Ave
- 715 Rosehill Dr
- 609 Monterey Ave
- 325 S 7th St
- 316 Sonoma Ave
- 446 Trinity Ave
- 620 Colusa Ave
Your Personal Tour Guide
Ask me questions while you tour the home.