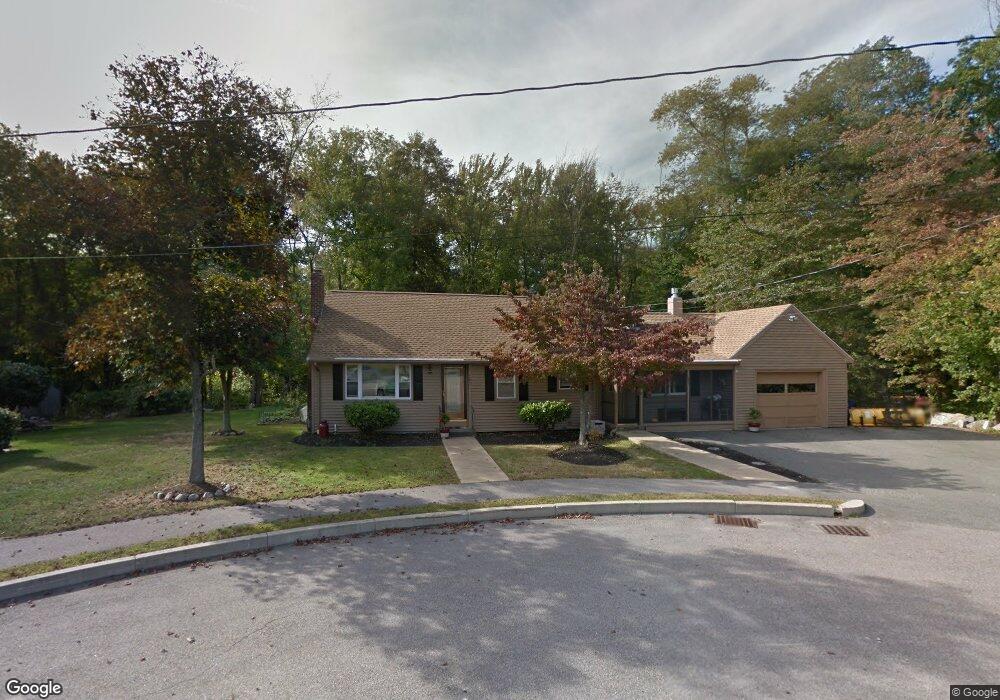
101 Regis Rd Braintree, MA 02184
South Braintree NeighborhoodEstimated Value: $581,000 - $737,000
3
Beds
1
Bath
1,238
Sq Ft
$550/Sq Ft
Est. Value
About This Home
This home is located at 101 Regis Rd, Braintree, MA 02184 and is currently estimated at $681,048, approximately $550 per square foot. 101 Regis Rd is a home located in Norfolk County with nearby schools including Braintree High School and Thayer Academy.
Ownership History
Date
Name
Owned For
Owner Type
Purchase Details
Closed on
Jan 6, 2021
Sold by
Fabiano Dorothy T
Bought by
Reynolds Thomas and Reynolds Dorothy
Current Estimated Value
Home Financials for this Owner
Home Financials are based on the most recent Mortgage that was taken out on this home.
Original Mortgage
$405,000
Outstanding Balance
$358,139
Interest Rate
2.71%
Mortgage Type
New Conventional
Estimated Equity
$322,909
Purchase Details
Closed on
Oct 31, 2002
Sold by
Higgins James J and Higgins Carol A
Bought by
Fabiano Dorothy T
Create a Home Valuation Report for This Property
The Home Valuation Report is an in-depth analysis detailing your home's value as well as a comparison with similar homes in the area
Home Values in the Area
Average Home Value in this Area
Purchase History
| Date | Buyer | Sale Price | Title Company |
|---|---|---|---|
| Reynolds Thomas | -- | None Available | |
| Fabiano Dorothy T | $350,000 | -- | |
| Fabiano Dorothy T | $350,000 | -- |
Source: Public Records
Mortgage History
| Date | Status | Borrower | Loan Amount |
|---|---|---|---|
| Open | Reynolds Thomas | $405,000 | |
| Previous Owner | Fabiano Dorothy T | $80,000 |
Source: Public Records
Tax History
| Year | Tax Paid | Tax Assessment Tax Assessment Total Assessment is a certain percentage of the fair market value that is determined by local assessors to be the total taxable value of land and additions on the property. | Land | Improvement |
|---|---|---|---|---|
| 2025 | $7,064 | $707,800 | $475,300 | $232,500 |
| 2024 | $6,260 | $660,300 | $431,500 | $228,800 |
| 2023 | $5,821 | $596,400 | $387,700 | $208,700 |
| 2022 | $5,561 | $558,900 | $350,200 | $208,700 |
| 2021 | $5,199 | $522,500 | $316,500 | $206,000 |
| 2020 | $4,868 | $493,700 | $287,700 | $206,000 |
| 2019 | $4,799 | $475,600 | $275,200 | $200,400 |
| 2018 | $4,664 | $442,500 | $250,200 | $192,300 |
| 2017 | $4,489 | $418,000 | $237,700 | $180,300 |
| 2016 | $4,365 | $397,500 | $225,200 | $172,300 |
| 2015 | $3,985 | $360,000 | $187,700 | $172,300 |
| 2014 | $3,765 | $329,700 | $180,200 | $149,500 |
Source: Public Records
Map
Nearby Homes
- 4 Powdrell Ave
- 80 Lake St
- 6 Lunar Ave
- 107 Meadow Ln Unit 107
- 700 North St
- 18 Royal Lake Dr Unit 3
- 661 North St
- 12 Brewster Rd
- 7 Del's Way
- 47 Addison St
- 44 Shepard Rd
- 12 Howard Ave
- 9 Royal Crest Dr Unit 12
- 1 Royal Crest Dr Unit 12
- 6 Franklin St
- 15 Calvin St
- 875 N Main St
- 145 Hancock St Unit 307
- 145 Hancock St Unit 201
- 469 North St
Your Personal Tour Guide
Ask me questions while you tour the home.