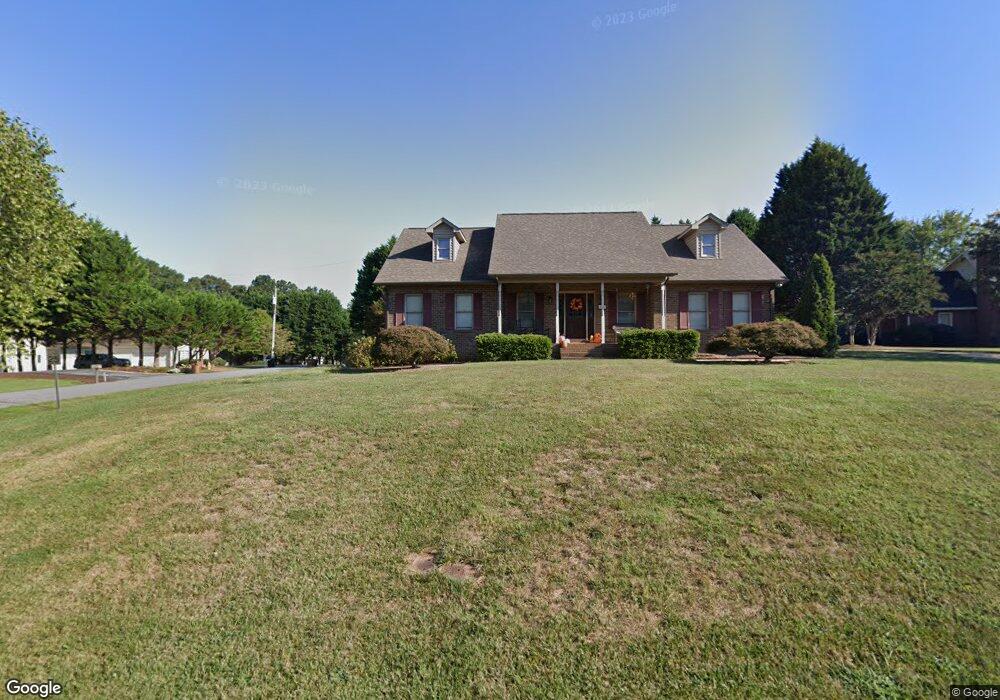
101 Robin Rd Lincolnton, NC 28092
Estimated Value: $418,000 - $476,000
5
Beds
3
Baths
2,447
Sq Ft
$181/Sq Ft
Est. Value
About This Home
This home is located at 101 Robin Rd, Lincolnton, NC 28092 and is currently estimated at $443,873, approximately $181 per square foot. 101 Robin Rd is a home located in Lincoln County with nearby schools including S. Ray Lowder Elementary School, Lincolnton Middle School, and Lincolnton High School.
Ownership History
Date
Name
Owned For
Owner Type
Purchase Details
Closed on
Jun 25, 2010
Sold by
U S Bank National Association
Bought by
Carroll Ii David L and Carroll Jennifer R
Current Estimated Value
Home Financials for this Owner
Home Financials are based on the most recent Mortgage that was taken out on this home.
Original Mortgage
$144,000
Outstanding Balance
$95,786
Interest Rate
4.74%
Mortgage Type
New Conventional
Estimated Equity
$348,088
Purchase Details
Closed on
Feb 8, 2010
Sold by
Blackburn Timothy Neil
Bought by
U S Bank National Association
Purchase Details
Closed on
Aug 5, 2005
Sold by
Emielita Glenna Mae Lowery and Emielita Leo Joseph
Bought by
Blackburn Timothy Neil
Home Financials for this Owner
Home Financials are based on the most recent Mortgage that was taken out on this home.
Original Mortgage
$23,900
Interest Rate
5.57%
Mortgage Type
Purchase Money Mortgage
Purchase Details
Closed on
Dec 16, 1991
Bought by
Lowery Glenna Mae
Create a Home Valuation Report for This Property
The Home Valuation Report is an in-depth analysis detailing your home's value as well as a comparison with similar homes in the area
Home Values in the Area
Average Home Value in this Area
Purchase History
| Date | Buyer | Sale Price | Title Company |
|---|---|---|---|
| Carroll Ii David L | $180,000 | None Available | |
| U S Bank National Association | $255,000 | None Available | |
| Blackburn Timothy Neil | $239,000 | None Available | |
| Lowery Glenna Mae | $151,000 | -- |
Source: Public Records
Mortgage History
| Date | Status | Borrower | Loan Amount |
|---|---|---|---|
| Open | Carroll Ii David L | $144,000 | |
| Previous Owner | Blackburn Timothy Neil | $23,900 |
Source: Public Records
Tax History Compared to Growth
Tax History
| Year | Tax Paid | Tax Assessment Tax Assessment Total Assessment is a certain percentage of the fair market value that is determined by local assessors to be the total taxable value of land and additions on the property. | Land | Improvement |
|---|---|---|---|---|
| 2025 | $4,261 | $412,481 | $35,500 | $376,981 |
| 2024 | $4,241 | $412,481 | $35,500 | $376,981 |
| 2023 | $4,241 | $412,481 | $35,500 | $376,981 |
| 2022 | $3,038 | $247,954 | $28,000 | $219,954 |
| 2021 | $3,038 | $247,954 | $28,000 | $219,954 |
| 2020 | $2,874 | $247,954 | $28,000 | $219,954 |
| 2019 | $2,874 | $247,954 | $28,000 | $219,954 |
| 2018 | $2,534 | $207,736 | $28,000 | $179,736 |
| 2017 | $2,433 | $207,736 | $28,000 | $179,736 |
| 2016 | $2,433 | $207,736 | $28,000 | $179,736 |
| 2015 | $2,470 | $207,736 | $28,000 | $179,736 |
| 2014 | $2,754 | $230,682 | $34,500 | $196,182 |
Source: Public Records
Map
Nearby Homes
- 110 Robin Rd
- 140 Robin Rd
- 68 Mockingbird Ln
- 916 E Park Dr
- 00 Lake Sylvia Rd
- 217 Rock Creek Dr
- 675 Heather Dr
- 101 Saddletree Rd
- 109 Saddletree Rd
- 515 S Academy St
- 818 Grier St
- 3347 & 3349 Gastonia Hwy
- 106 Saddletree Rd
- 238 Victory Grove Church Rd
- 584 Southside Church Rd
- 709 Catawba St
- 1218 W Highview Ln
- 329 E Congress St
- 810 & 812 Lincoln St E Unit 810
- 792 Carolina Mill Cir